Protected Recordings
The first goal of this study was to determine the percentage of historic recordings of interest to scholars and collectors that are currently protected under U.S. law. The average proportion of this sample found to be protected was 84 percent.2 A summary of protected recordings, presented by time period, appears in table 1.
Table 1. Summary: Protected recordings by time period
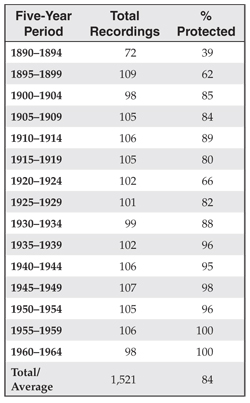
The proportion protected varies somewhat by period, although not as much as might be expected. Even for the earliest period, 1890–1894, 39 percent of sampled recordings are still protected today (all of them cylinders made by the Columbia Phonograph Company). In the late 1890s, the proportion rises to 62 percent, and in nearly every subsequent five-year period it exceeds 80 percent. The percentage protected peaks during 1900–1915, an early period of extreme concentration in the record industry, declines a bit during the late 1910s and early 1920s, when independent labels flourished, then rises to more than 90 percent after 1935, as major labels dominate the marketplace. In later years, smaller labels were increasingly bought by larger companies, whose successors retain rights to their recordings today.
The percentage classified as nonprotected, and therefore freely available for duplication and dissemination (16 percent), could be reduced by future claims of ownership. Already, one of the few notable labels believed to be “free” at the time this study was conducted has been claimed. Gennett, the jazz and blues label of the 1920s, is claimed by Concord through an ownership chain tracing back through Fantasy and Riverside.
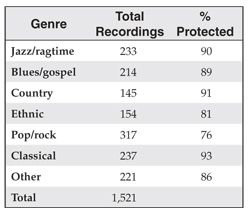
There is some variation in percentage of recordings protected by genre of music (table 2). Classical and country recordings are the most heavily protected overall, each exceeding 90 percent. Jazz and ragtime, blues and gospel, and “other” (mostly show music) are in the 86 percent to 90 percent protected range. On the low end are popular (76 percent) and ethnic (81 percent) recordings.
Table 2. Summary: Protected recordings by genre
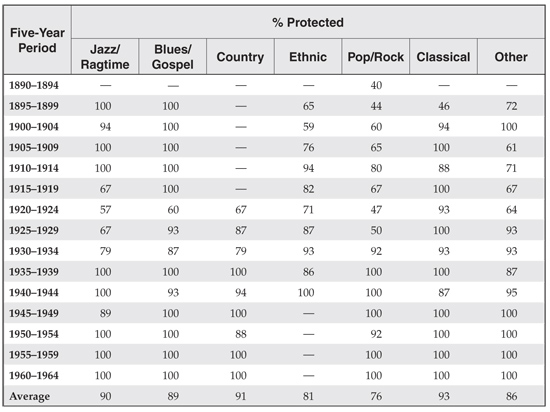
It is difficult to generalize about the trends over time within genre, because breaking down the sample into such small segments results in unstable data (there are usually only 15 to 20 recordings per time period per genre). However, the data indicate that the majority of historic U.S. recordings are still under a current owner’s control, and that this ownership extends over all genres of music and all time periods since the 1890s (table 3).
Table 3. Summary: Protected status by genre and time period
Reissues
Drawing next on the sample that included only protected recordings, we looked at the number of CD reissues of protected historic recordings by rights owners, their licensees, and others (see table 4). Here we found distinct differences by period. On average, rights owners have made available 14 percent of the historic recordings that they control from the various eras.3 However, the percentage varies greatly by age. For the two post-1955 periods, the rock-and-roll era, they have reissued 33 percent to 34 percent. This number declines sharply in earlier periods. The 1940s and early 1950s average 25 percent reissued, and the late 1930s (the beginning of the big band swing era) average drops to 15 percent. In most periods before that, rights holders have reissued 10 percent or less of their holdings, and in some periods virtually none. The 1 percent reissued for the early 1890s, it should be noted, is based on a single reissued recording, to our knowledge the only recording of that era reissued by a rights holder, which happened to fall into our limited sample.
Table 4. Summary: Reissues of protected recordings
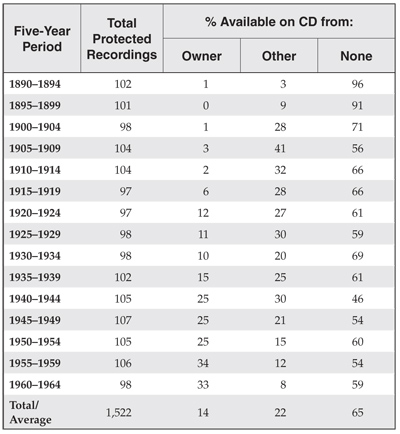
Unsurprisingly, rights holders tend to reissue recordings that were made within the life span of their current mass customers-essentially the nostalgia market. The rights holders virtually ignore earlier periods, no matter how historically important recordings from those periods may be. It is difficult for third parties to reissue such material legally.
How much demand is there for historic recordings? The number of unauthorized reissues by other entities, such as foreign labels (which are not subject to U.S. copyright laws) and small domestic operations operating under the legal radar, may give some evidence of the potential demand. An additional 22 percent of historical recordings have been reissued by these other entities, which is substantially more than are made available by the rights holders themselves. This figure reflects recordings reissued exclusively by others and not by the rights holders (not recordings issued by both). The percentage of exclusive reissues by third parties does not differ as significantly by time period as does that of reissues by the rights holders. Non–rights holders have reissued 20 percent to 40 percent of these recordings for most periods from 1900 to 1950. The percentage drops off after 1950 as rights-holder reissues become more frequent.
As a result of these differing patterns, more historic recordings are made available by non–rights holders than by rights holders for every period up to 1945. While historically important recordings may not constitute a large-enough market for rights holders to invest in, they are clearly of enough cultural interest to persuade others to reissue some of what the rights holders themselves decline to make available, despite the legal obstacles to doing so. There is a measurable public interest in these recordings, and individuals and organizations are willing to serve it.
An analysis of reissues of historic recordings by genre (see table 5) reveals some interesting disparities. Recordings in the “other” category (spoken word and show music) are most likely to have been reissued by rights holders, at an average 28 percent. Country music is the second-highest field of rights holder interest, with 20 percent reissued. Ethnic recordings appear to have been very poorly served, with only 1 percent reissued. Surprisingly, jazz and ragtime music, blues and gospel, and popular music are all around only 10 percent reissued.
Table 5. Summary: Reissues of protected recordings by genre
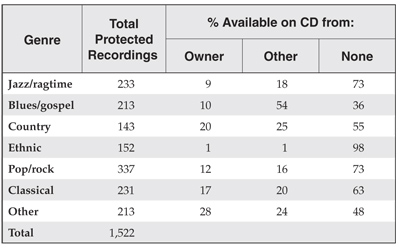
In virtually every category, parties without legal rights-foreign labels and domestic non–rights holders-have made more historic U.S. recordings available than have rights holders. Blues and gospel music has been particularly well served by third-party reissuers, although a significant demand for reissues seems to exist in every genre, with the possible exception of ethnic.
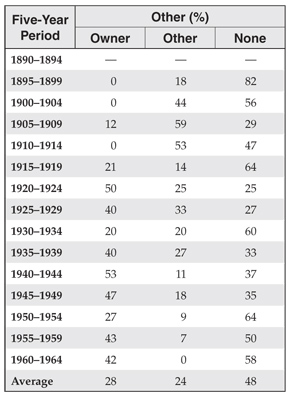
Tables 6 through 9 show reissues of protected recordings by time period within genre. These data should be regarded as very approximate and subject to fluctuation, owing to the small sample sizes when the sample is broken down this finely (again, there were only about 15 to 20 recordings for each genre within each five-year time period).
The general pattern of rights-holder reissues is the same within genre as it is overall. Recent periods are heavily mined for reissues; earlier periods are largely neglected. In fact, we found no rights-holder reissues of jazz or ragtime in this sample for periods before 1915, and only one popular recording before 1930. This does not mean that rights holders have reissued no such recordings; it simply indicates that such reissues are such a tiny percentage of those that interest scholars and collectors that they did not show up in our sample.
Others have taken up the slack in earlier periods, especially with reissues in the blues, classical, jazz, and other (show music, spoken-word) fields.
Table 6. Reissues of protected jazz and blues recordings
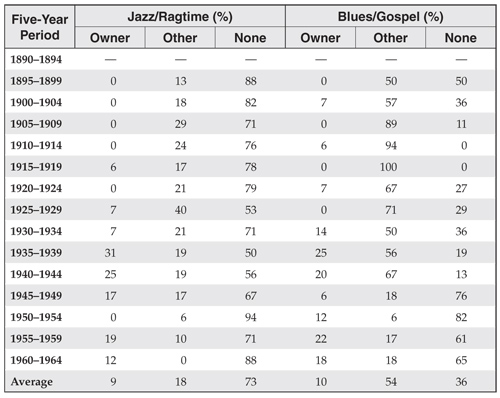
Table 7. Reissues of protected country and ethnic recordings
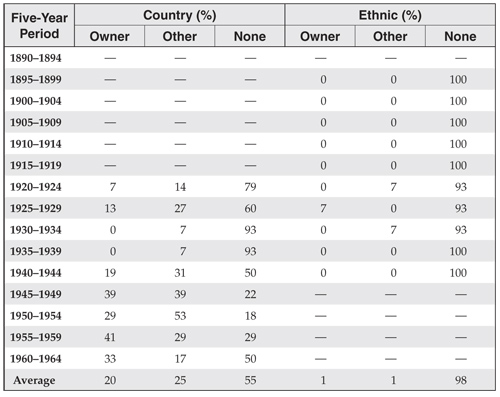
Table 8. Reissues of protected popular and classical recordings
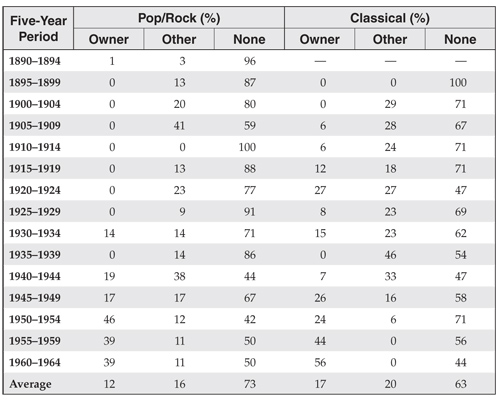
Table 9. Reissues of protected other (show music, spoken word) recordings
FOOTNOTES
2 This is the average percentage for the 15 five-year periods between 1890 and 1964. It is not weighted by the number of recordings issued in each period. The percentage protected does not vary much by period, so skewing the percentage toward more-recent periods, in which more records were issued, should not result in a significantly different number.
3 As with percentage protected, this is the average percentage reissued for the 15 periods examined. Since more recordings were made in later years, and the rights-holder reissue rate is also higher for later years, the gross reissue percentage for all recordings listed in the consulted sources would presumably be higher-at least for rights holders. The central purpose of this study was to determine reissue percentage by time period, however, not to favor more-recent periods, so the latter percentage is less relevant.
