—By Alberto Campagnolo
As a trained book conservator, I enjoy a deep and intimate knowledge of (and relationship with!) books as working objects. Even though books have taken many forms over the centuries—the scroll being the most important book form in antiquity—today’s quintessential format is the codex. A codex is a collection of sheets folded in half (called a gathering; also known as quire, or signature), fastened at the spine, and generally completed by covers. The gathering is the principal physical feature of the book in codex format, and the bifolium—the sheet folded in half—is its constituent unit.
When books are digitized, photographs are taken of each side of each page. These are then presented in sequence, from the first to the last side of the last page. The interface does not generally show information about the original gathering structure and which pages were physically connected, one at each side of the fold. Technically, information about gathering structures is recorded through “collation formulas” (collation being another term to indicate the gathering structure)[i], but they are dense and difficult to read for very complex structures. In addition, there is no agreed-upon standard for how to compile these formulas for manuscripts. Because of the limitations of collation formulas, scholars often resort to recording information in diagrammatic visualizations, such as the example in Figure 1, that are much better suited as communication devices but are cumbersome to hand-draw and then store as image files.
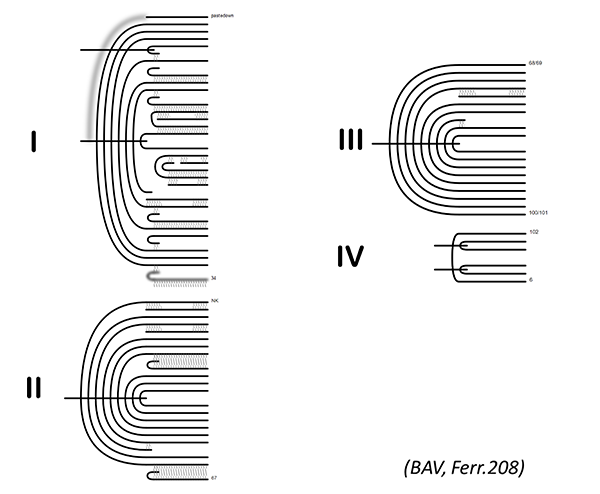
Books can have rather complicated lives, and this is mirrored in their gathering structure that shows the intricacies of their history of changes and additions. When I was a book conservator contractor at the Vatican Library, for example, I had to work on a particularly complicated manuscript whose structure reflected the author’s working, as he deleted poems by pasting pages together and then inserted new ones when needed (see Figure 1).
Figure 1. Example of a particularly complex gathering structure in four gatherings (BAV, Ferr. 208). Each line depicts a page, showing how many pages had been added by the author as he proceeded with his writing; shaded areas indicate pasting, and cross lines that go—generally—from the center of the gathering toward the spine indicate book sewing.
In the mid-2000s, Dot Porter had the idea to create a tool to describe and represent the gathering structure of books. In 2013, a first prototype was put together. At the time, I was working on my PhD project on an automated visualization system for historical bookbinding structures, something very similar to part of Dot’s idea, but for other book structures, beyond the gathering assembly. We started a fruitful collaboration that continues today, and VisColl, the tool to describe and visualize the collation of books, was born.
Through a series of subsequent iterations, VisColl went from a simple proof of concept to a tool capable of describing ever more complex structures. I did my CLIR postdoctoral fellowship at the Library of Congress in Washington DC, and the proximity to Philadelphia meant that I was able to collaborate easily with Dot—though on the side. This led to the deployment and release of the latest version, VisColl 2, last June, after an intense month of work, and thanks to a Visiting Research Fellowship at the Schoenberg Institute for Manuscript Studies.
VisColl provides many services in one tool. The first—and foremost—component is the theoretical model that allows one to describe gathering assemblies in a structured and computable manner, through an eXtensible Markup Language (XML) Schema that declares what to describe and how. Based on this model, gathering structures can be modeled and recorded within XML files. Once data is recorded in this manner, it is computable and can be transformed, through scripts, into other forms. One can, for example, write a code to generate collation formulas according to a specific style, or take the information and have the computer generate—in a fraction of a second—a collation diagram. The illustration in Figure 1 was automatically generated in this manner.
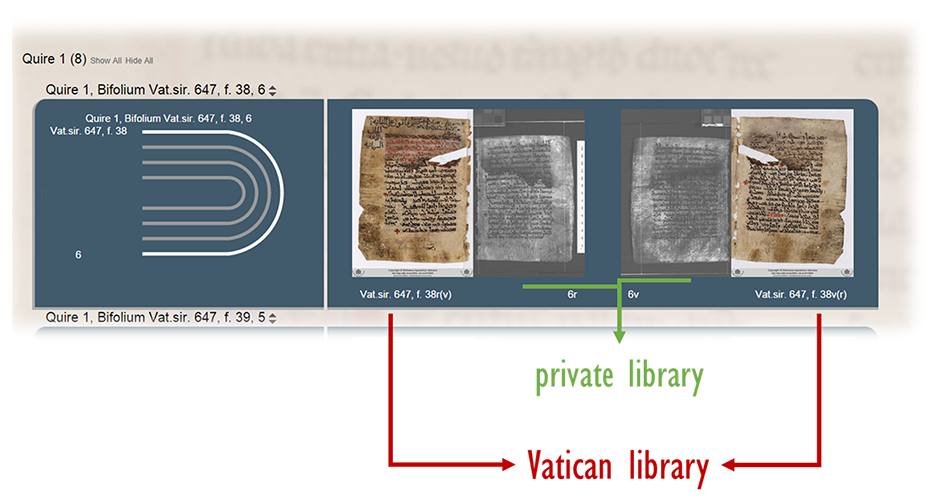
VisColl also allows one to generate a series of web pages that aim at reconstituting the bifolia from a series of digitized photographs, re-joining—virtually—the pages that were physically joined together at the fold in the original codex. This permits one to study the object as if it were disbound in front of the reader. Figure 2 shows an example of this interface. In this case, the images of the reconstituted bifolia come from the pages of the fragmentary Syriac Galen palimpsest, a manuscript produced in the first half of the ninth century and subsequently reutilized and conserved in the library of the Monastery of Saint Catherine on Mount Sinai, Egypt. The bulk of the codex is now in a private collection in the United States, while some pages remain scattered in other libraries, among which two are at the Vatican Library. Therefore, not only do VisColl visualizations show together pages that used to be physically united before digitization, but, in this instance, also pages that used to be part of the same bifolium and are now an ocean apart!
 Figure 2. VisColl visualization reconstituting a bifolium of the original Syriac Galen Palimpsest.
VisColl—released in open-source—has been well received by the scholarly community, and we will continue developing the tool, integrating more features to describe and present this important aspect of the physical make-up of our written heritage.
[i] See this blog post by the Folger Shakespeare Library for an introduction to collation formulas.
Alberto Campagnolo is a former CLIR Postdoctoral Fellow in Data Curation for Medieval Studies. He is currently adjunct professor in Digital Humanities at the University of Udine, Italy. Follow him on Twitter at @ACampagnolo.


