
We now have reached the point where we have all the elements necessary to utilize isoperm diagrams in answering questions like those posed in the Introduction. The remainder of this paper will explore various scenarios to illustrate how % RH vs. T isoperm diagrams can assist in making preservation management decisions.
As a simple illustration consider the scenario: A collection of relatively short-lived papers (perhaps newsprint paper estimated to have a permanence of 45 years under 68 degrees F/50% RH storage conditions) must be moved to make room for a more valuable collection. It is suggested that the papers be temporarily (1-2 years) placed in storage in a utility tunnel. The site chosen is next to a slow-leaking steam line, and the papers will be in an environment of 95 degrees F and 80% RH. What are the preservation consequences of making this move? Referring to Figure 2 we see that the 90 degrees F/80% RH conditions lie between the 0.10 and 0.02 isoperm line–we can estimate a 0.03 isoperm value. We conclude that under the new storage conditions the collection’s life expectancy would be reduced to about 3% of the permanence at the initial conditions – – that is, about 16 months. Even given the uncertainties inherent in the estimation[4],one or two years of this “temporary” storage would destroy the collection! The preservation manager is now armed to reject the proposal and suggest an alternative.
Diagrams plotting %RH vs. T can be of value even in the absence of an isoperm application. Very often discussions of preservation issues with non-specialists are more effectively conducted through the use of graphs and other visual aids. For example, the area on Figure 4 labelled TOO INFLEXIBLE quickly communicates the idea that because papers stored at low relative humidities (say less than 30% RH) with their low attendant moisture content, are, whatever their strength, so inflexible as to be prone to damage in handling. The graph quickly communicates the idea that papers should never be exposed to the labelled area conditions. Similarly, high relative humidities are conducive to mold formation and foxing of paper. The area labelled MOLD indicates environmental conditions to be avoided if these forms of biological deterioration are to be prevented.[5]
Figure 5 shows an area labelled TOO RAPID DETERIORATION; it expresses a specific management decision. A policy decision has been made by the preservation manager or director or even at the board of trustees level that no item in the collection should ever (whether in storage, exhibition, shipping, on loan, and so forth) be exposed to environmental conditions at which it will deteriorate at a rate (say) three times greater than that of the institution’
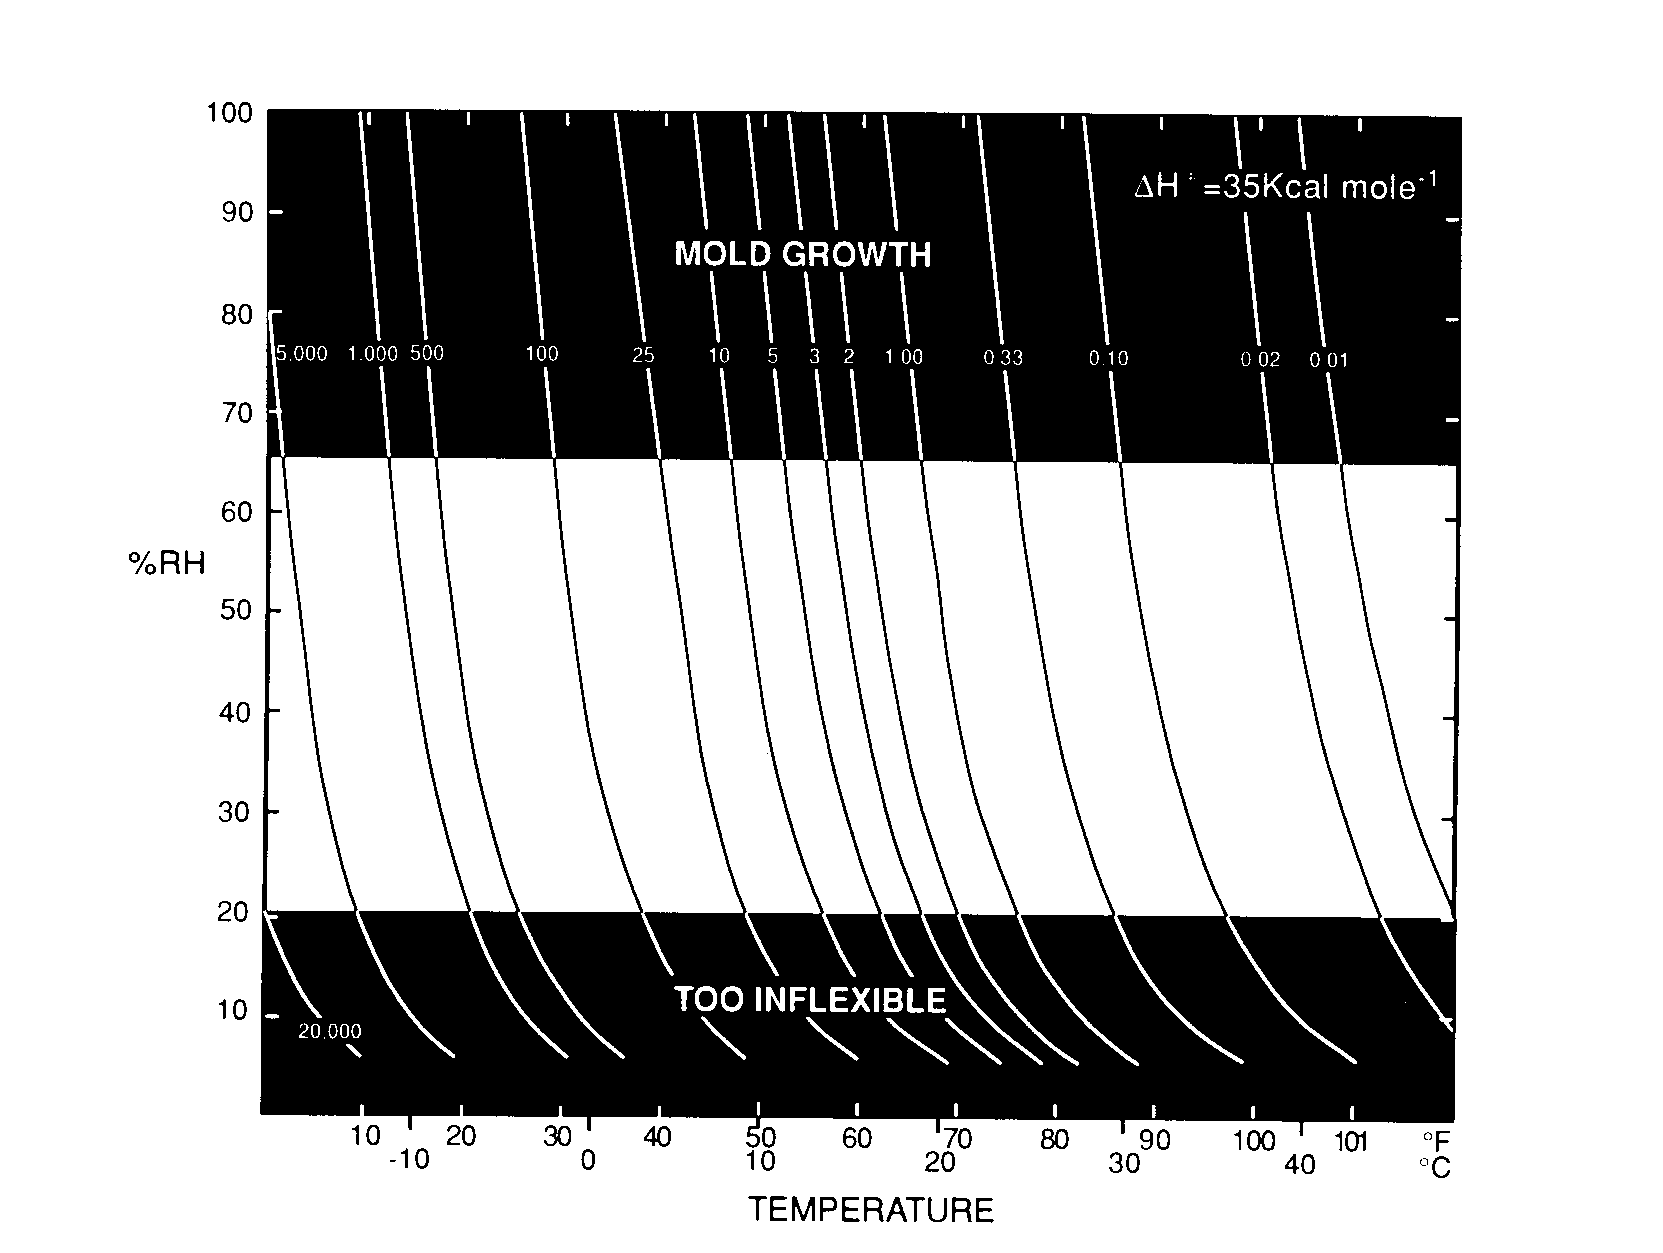
Fig. 4. Percent relative humidity versus temperature Isoperm diagram displaying environmental conditions unsuitable for paper. Relative humidities greater than 65% subject paper to hazards of mold growth and foxing; values less than 20% RH reduce paper flexibility to potentially hazardous levels.
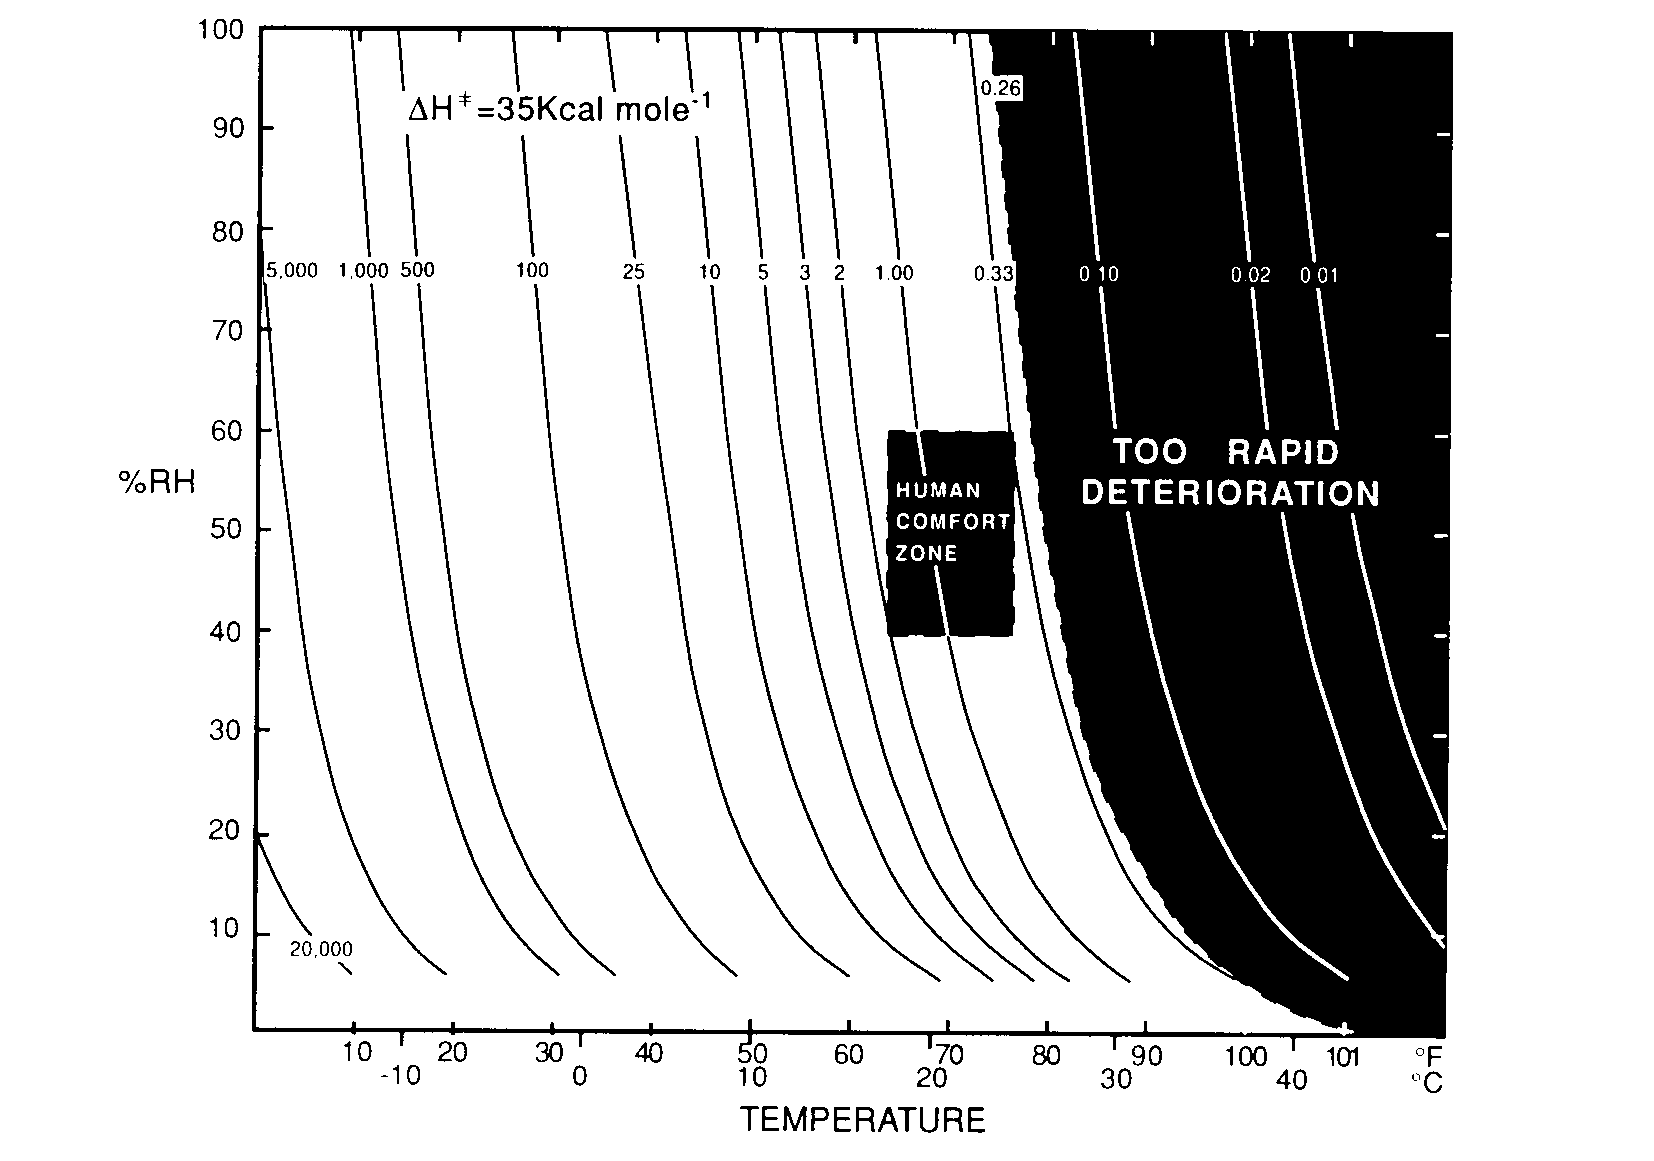
Fig. 5. Isoperm diagram displaying environmental conditions for which deterioration is so rapid that paper permanence is one-quarter or less than conditions of 68 degrees F and 50% RH. Also shown are relative permanence values associated with environmental conditions associated with human comfort
normal storage conditions of 70 degrees F/50% RH (an isoperm value of 0.79). The preservation manager can construct an isoperm at the 0.26 value; all exposure of objects to conditions to the right of 0.26 isoperm (the labelled area) are barred by the policy. A % RH vs. T isoperm with the restricted area(s) indicated could be made part of any loan agreement between institutions.
Figure 5 also displays an area labelled HUMAN COMFORT ZONE. HVAC engineers, architects and the Occupational Safety and Health Administration (OSHA) have defined a range of temperature and relative humidity conditions that provide acceptable comfort and safety for humans working in or occupying a building.[6]Such
a relatively wide range of conditions allows libraries and archives with good environmental control systems to select and maintain specific conditions within these limits. The ultimate choice often is established by the director after consultation with HVAC engineers, system operators, perhaps an architect, various staff members and union representatives. The director will obtain information about capital and operating costs and maintenance expenses for various conditions; there may be a history of complaints from public and staff about hot, cold, clammy, and other conditions; and the architect may indicate potential structural damage from excessively high percent relative humidity conditions. What should the preservation manager’s contribution and recommendations include?
The earlier discussion of potential mold growth and damage from paper (and book structure) inflexibility clearly would be relevant, but the choice made within the range of possible conditions can profoundly affect the preservation of the collection. In Figure 5 the least favorable conditions are associated with the upper right hand corner at 76 degrees F/60% RH; this corresponds to an isoperm value of 0.33. The conditions most conducive to preservation are found in the lower left corner at 64 degrees F/40%, a 2.0 isoperm value. The human comfort zone thus encompasses a six-fold range in collection permanence. This relationship can be easily communicated to the director and advisors and used to support the recommendations of the preservation manager to establish low % RH, low T conditions.
Figure 6 displays what are by now fairly obvious applications of the % RH vs. T isoperm diagrams and one much less obvious application.
An arbitrarily selected point at 50 degrees F/45% RH is shown surrounded by a dashed box. This represents the preservation conditions with the environmental control system with 50 degrees F/45% RH as its set point and 3 degrees F and 5% RH its control limits. The isoperm running through the set point is 9.6, and the isoperms are 6.0 and 15.7 at the excursion limits of 53 degrees F/50% RH and 47 degrees F/40% RH respectively. Thus the selection of these values for the set point and excursion limits results in a 15.7/6.0=2.6 factor in permanence. Narrowing the excursion limits will reduce the range in permanence–undoubtedly at higher capital and operating costs–but extending the limits too widely will ultimately allow conditions of an excessively high deterioration rate.
The selection of set points and operating limits and their accompanying influence on cost:benefits ratio is however somewhat more complicated than so far presented. Looking at a % RH vs. T isoperm diagram we see that, except at very low % RH’s, the curves fall very steeply, which implies deterioration rate is much more sensitive to T than to % RH changes. In the example chosen of 50 degrees F/45% RH, we can use Figure 5 (or for greater accuracy, Equation 5) to show the isoperm value changes by a factor of 1.13, i.e., 13% for each degree of temperature change but only by a factor of 1.02 (or 2%) for a one percentage point change in % RH. When the chemical deterioration factor is taken alone, the preservation manager will probably decide to devote more resources to temperature control than to relative humidity control. This judgment is supported by the observation made earlier that the moisture content of books responds more slowly to environmental changes than does the temperature of books. Thus all but the outermost edges of a book would be at equilibrium with the long-term average relative humidity
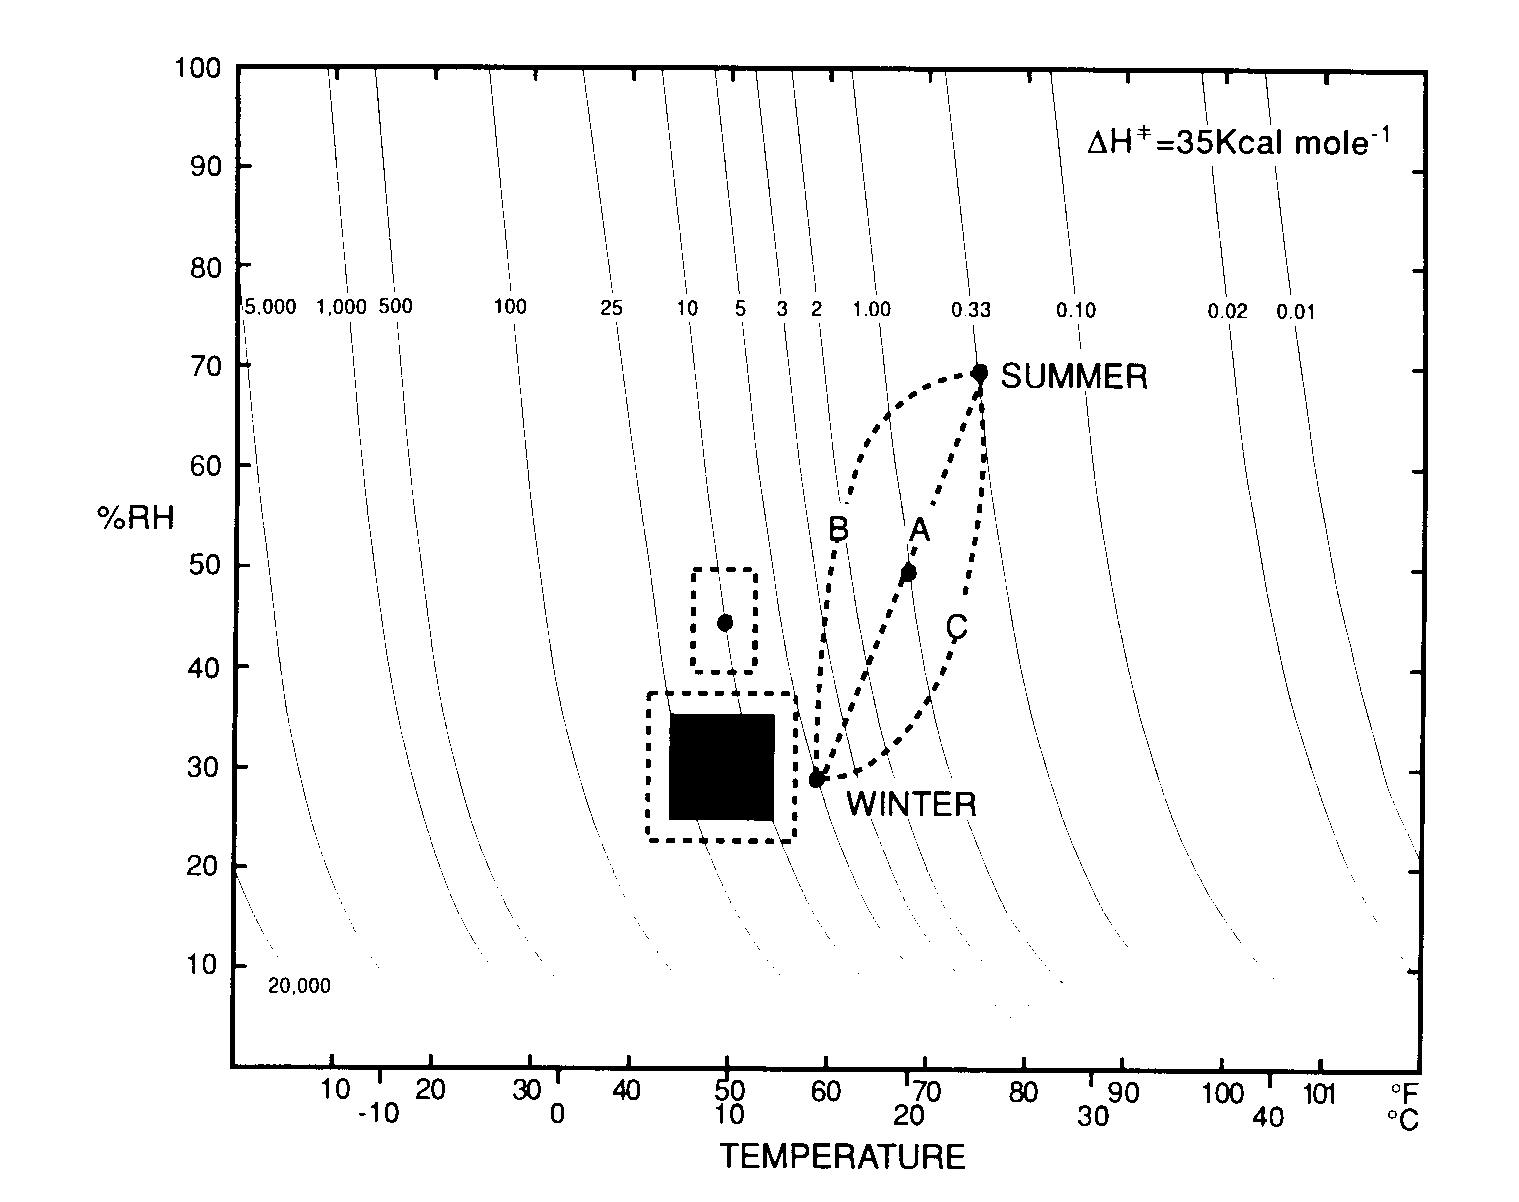
Fig. 6. Isoperm diagram displaying environmental set points and tolerance limits. Set points are shown as ; set ranges are indicated by ; tolerance limits are indicated by surrounding broken lines. Also shown are permanence consequences of annual cycling between winter (60 degrees F, 30% RH) and summer (80 degrees F, 70% RH) environmental conditions.
Figure 6 addresses a question posed in the Introduction suggesting that for economic and/or operational reasons two set points should be established for the collection. The first, for winter months, is of lower % RH and T; the second, for summer months, has a higher % RH and T. The three dashed lines connecting the two conditions represent the environmental path taken in transitioning between them. Appropriate choices for the two conditions are anticipated to give a satisfactory intermediate average isoperm value that satisfies the preservation requirements. However, the preservation consequences of annual cycling need to be examined in considerable detail since cycling is more complex than it first appears.
Suppose the non-cycling environment is taken as 68 degrees F/50% RH and the (unrealistically large but useful for illustrative purposes) annual cycling is 8 degrees F and 20% RH. The summer and winter conditions therefore are 76 degrees F/70% RH and 60 degrees F/30% RH. These conditions have isoperm values (estimated from the % RH vs. T isoperm diagram or more accurately calculated from Equation 5) of 0.29 and 4.3 respectively. If, for simplicity, we assume that the collection spends six months in each environment, i.e., the conditions are abruptly changed from winter to summer and the collection instantaneously equilibrates to the new conditions, we can now ask the question, “how will a collection cycled over the 12-month period fare compared with a constant 68 degrees F/50% RH?”
Our first observation is that summer conditions result in a deterioration rate 1/0.29=3.5 times greater than the constant conditions, while winter conditions yield a 4.3/1.0=4.3 factor decrease in deterioration rate. From this we might (incorrectly!) conclude that (apart from any potential cost savings) cycling results in greater preservation of the collection. This incorrect assessment is apparently reinforced by taking the average of the two isoperms, (4.9=0.29)/2=2.3, suggesting enhancement of permanence by a factor greater than 2.
The key to a correct understanding of cycling effects is best seen by an automobile analogy. Suppose a car is driven for two hours in two different ways: the first, for two hours at a constant speed of 50 mph; the second, one hour at 4 times the 50 mph speed and one hour at 1/4th the 50 mph speed. How many miles (how much paper deterioration occurs) in the two scenarios? In the constant speed case we have 2 x 50=100 miles, but in the second we have 1 x 4 x 50 + 1 x 1/4 x 50=212.5 miles. In a similar way, the approximately 4x greater deterioration in the six summer months is not compensated by the six winter months of 1/4th rate of deterioration and in fact (using our automobile analogy) we may anticipate approximately twice the deterioration.
The summer and winter seasonal isoperm values of 0.29 and 4.3 may be used to calculate an annual average deterioration rate and a (correct!) average isoperm value by recalling that relative deterioration is the inverse of relative permanence or isoperm value. Thus the summer and winter deterioration rates are 1/0.29=3.5 and 1/4.3=0.23, giving an annual average deterioration rate of (3.5 + 0.23)/2=1.9 which in turn corresponds to a 1/1.9=0.5 isoperm value. Calculation of average isoperm values for other seasonal environmental conditions and time periods follows this same “inverse-inverse” method of averaging.
This examination of cycling has much broader implications for the preservation of collections since it shows that any departure from moderate fixed to rapid deterioration conditions, even for relatively brief periods of time, results in more deterioration than might first be expected. Recalling our earlier example, even one short exposure of the collection to the hot, damp, leaking steam pipe environment greatly reduces its expected useful life.
Returning to Figure 6 allows us to develop a transitioning strategy between the two seasonal conditions that can to some extent mitigate these cycling effects. Path A is like the example discussed, except the transition takes place over a period of weeks or months with the % RH and T each changed at a constant rate. Path B also moves uniformly over time, but in going from winter to summer and summer to winter conditions the rate of temperature change is varied so that for much of the year the collection remains in the high isoperm values thereby enhancing permanence. In going from summer to winter conditions we lower the temperature as rapidly as possible and allow the relative humidity to catch up more slowly; going from winter to summer is the reverse–we keep the collection cold as long as possible then rapidly raise the temperature. Path B is also the one most easily achieved in practice since as already noted, book temperatures respond more rapidly to environmental changes than does book moisture content. Path C is one which clearly results in more deterioration than A or B.
Figure 6 also displays a rectangular block surrounded by a dashed line box. This, rather like the depiction of a human comfort zone, is the representation of the range of T and % RH conditions specified as a standard. A library can meet the standard by establishing a set point anywhere in the solid outlined box with the dashed line indicating the maximum T and % RH departure allowed from the set point. The preservation implications of a specific standard can be drawn by following the procedures already described.
One of the most difficult problems facing the preservation manager is the selection of set points, operating ranges and cycling patterns for the collection environment especially where selections must be made from alternative (and sometimes even conflicting) standards. The following scenario describes such a situation with an analysis that illustrates the role isoperms can play in understanding and quantifying various implicit preservation issues.
A group of expert conservators, after considerable deliberation and using the available scientific information as well as their years of practical experience, proposes the set of storage conditions displayed in Table 1. Several broad distinctions and categories were established: Bound materials were distinguished from unbound; a Preservation Collection was identified as distinct from the General Collection. Distinct diurnal and annual environmental conditions were allowed as was specification of the rate of change between them. Very low temperature storage conditions were specified (presumably for special collections). Alternative standards were proposed to allow costs and other practical considerations to be weighed in the ultimate choices and decisions. The challenge to the preservation manager is to understand in detail what is being proposed and how to implement the appropriate standard
A.

SET POINT RANGES

      GENERAL COLLECTION                      PRESERVATION COLLECTION

 BOUND RECORDS      UNBOUND RECORDS    BOUND RECORDS        UNBOUND RECORDS

Temp, ° F    %RH    Temp., ° F   %RH   Temp., ° F     %RH     Temp., ° F    %RH

65-70     40-55        65-70  25-35      55-65   30-40     55-65      25-30

                                         45-55   25-35     45-55      25-30

                                         35-45   20-25     35-45      20-25

                                             0*  20-25*        0*     20-25*

*Hermetically sealed at this % RH before reducing temperature to

0° F.
B.

SET POINT TOLERANCES

GENERAL AND PRESERVATION COLLECTIONS

DIURNAL   ±2°F    3%RH

ANNUAL    ±2°F    5%RH

    MAXIMUM CHANGE

    PER MONTH
Table 1. Environmental conditions illustrative of those proposed for storage of paper documents.
Even a few minutes spent examining Table 1 raises a number of questions and issues not easily addressed by the proposal itself: How “good” are the various proposed standards for the General Collection? How do they relate to one another in permanence value? On what basis can we choose one over another? The environmental conditions proposed for the Preservation Collection appear “better” but how much better? Substantially? Significantly? Since the distinction between bound and unbound material probably expresses concerns about stresses by and on binding structure, do the standards show differences that consistently reflect structural considerations? Is it T or RH that the standards suggest impacts most on binding structures? Can one even begin to estimate a cost:benefit ratio for the alternative standards? Are any of the standards compatible with comfort and safety requirements of staff and users? The preservation manager undoubtedly can raise many more questions and issues to address before recommending a course of action.
Figure 7 displays the different standards proposed in Table 1 on a %RH vs. T isoperm diagram. In the figure, some of the relationships and the various proposed standards are immediately evident and answers to the previous questions clearly depicted: Unbound materials can be kept at lower relative humidities although some standards propose identical (i.e., in the diagram) overlapping, storage conditions. The General Collection, whether bound or unbound, is stored under less favorable conditions than the Preservation Collection; in fact one might ask if the conditions are adequate since the maximum bound General Collection isoperm has a 1.8 value. On the other hand, some Preservation Collection isoperm values are quite large–storage at 30 degrees F/20% RH has a 150 isoperm value. Under these conditions, a paper with a lifetime of 75 years at 68 degrees F/50% RH would be expected to survive for more than 10,000 years. Even more questionable, perhaps, is the standard proposing storage at 0 degrees F/25% RH. Here even an extremely short-lived paper of say 5 years would be expected from the isoperm value of 15,000 to survive for 75 millennia! Even allowing for major uncertainty in the isoperm value because of such extreme pressure on the assumptions and approximations in the isoperm method, it is questionable whether such storage conditions can be economically justified and whether we know enough about sealed storage conditions and how they may promote deterioration.
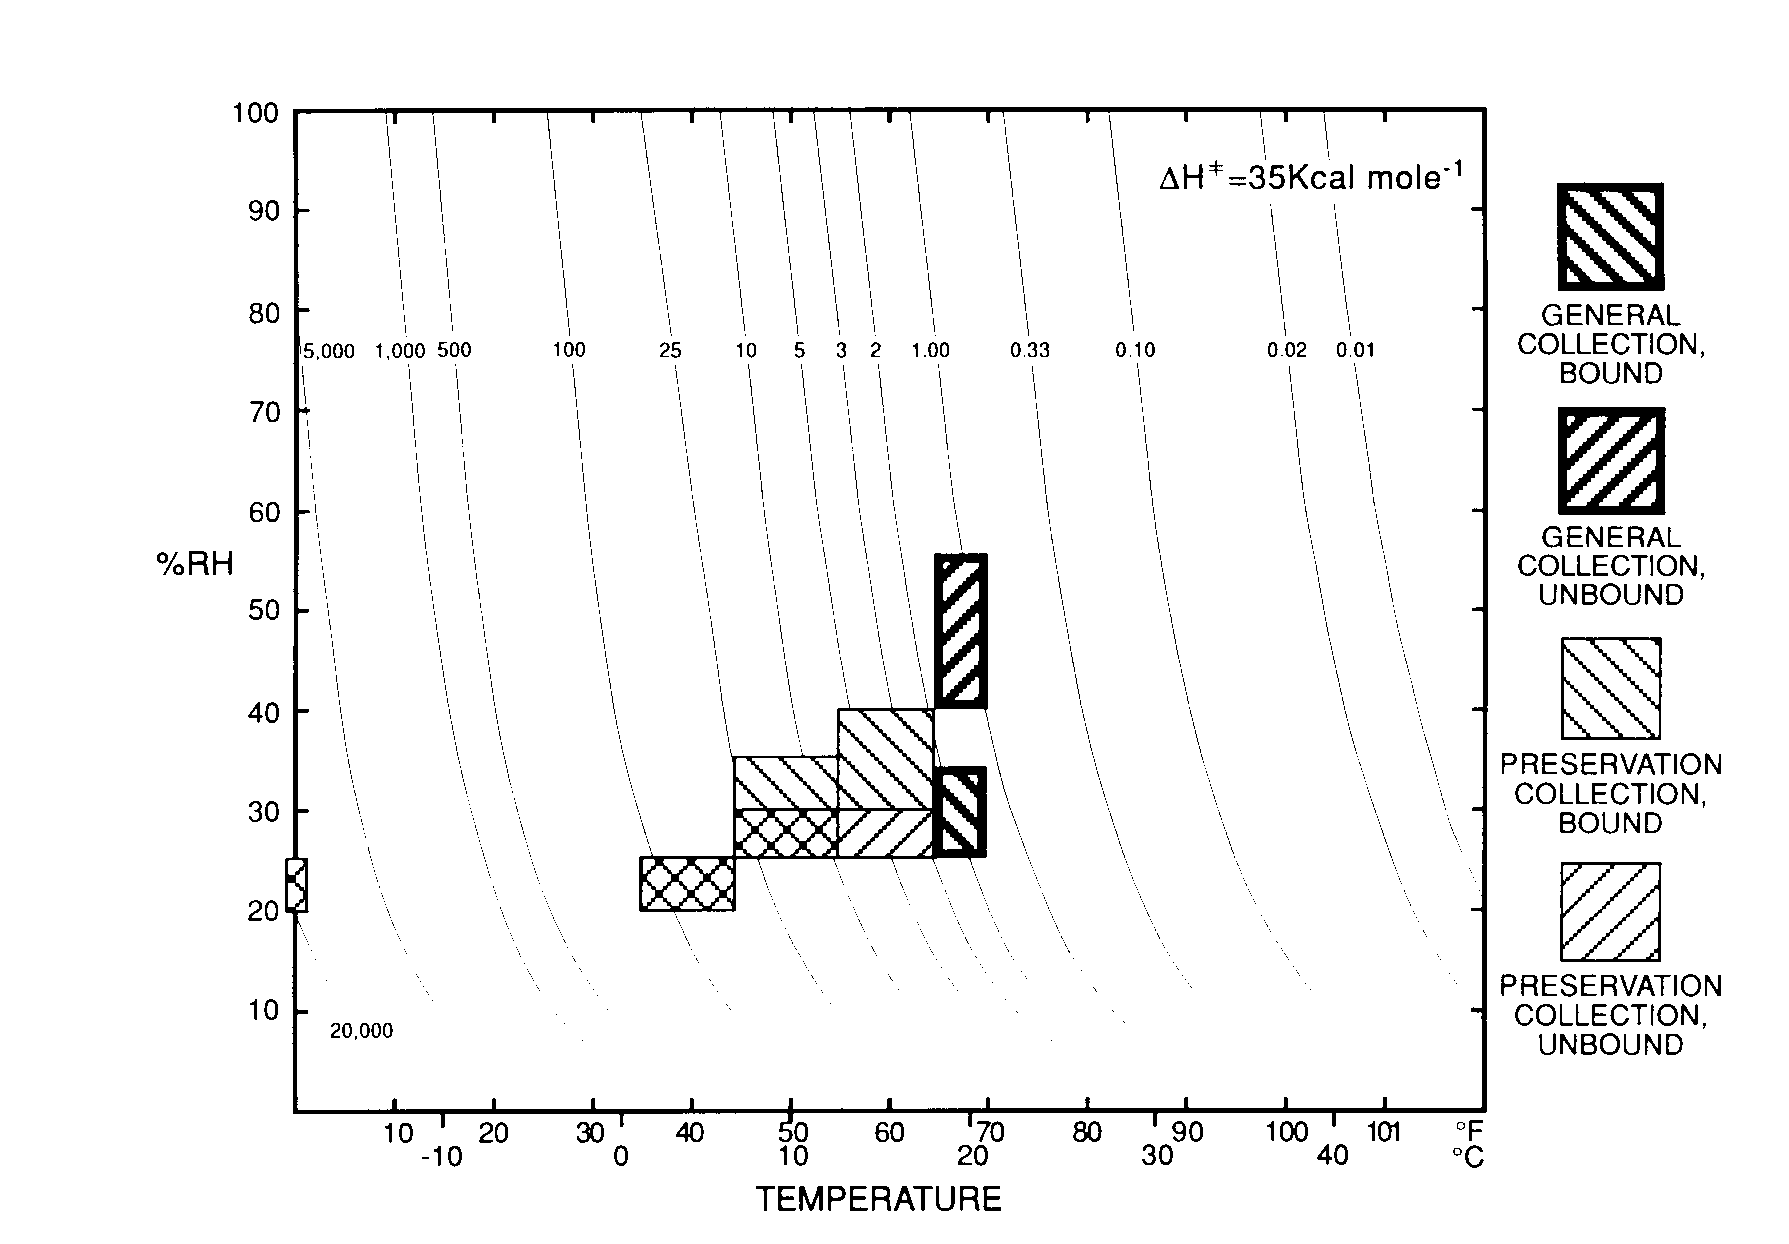
Fig. 7. Isoperm diagram displaying set points and ranges illustrative of those proposed for paper document storage (Table 1).
The % RH vs. T isoperm diagrams do not, of course, make decisions but Figure 7 amply illustrates how they can, by their convenience and quantitative aspects, provide information to assist preservation managers in making decisions.
From the applications presented and scenarios considered, it would be easy to presume that isoperm concepts are applicable only to institutions with large staffs and sophisticated HVAC systems. In fact, the isoperm method may be of even greater value where staffs are small, such systems are lacking and environmental control is more difficult to achieve. Examples may range from the very small, locally supported historical society with some holdings of books, letters and newspapers, which is open only in the summer and is closed and unheated in the winter months, to a medium size or even large library or public records office with adequate (or perhaps excessive) heating in the winter and open doors and windows in the summer. In some cases, a small staff may mean the director wears the preservation manager’s hat as well as many (perhaps all) others. How can isoperms help in these cases?
Perhaps the greatest barrier to improvement in the preservation environment is the inability to assess the current preservation state and to ascertain whether and how changes can improve that state. Knowledge of the preservation consequences (gained from isoperm diagrams) of making changes of only a few degrees in temperature can provide the additional motivation to make these and additional changes.
Undoubtedly the first step (if it has not already been done) is to measure temperature and percent relative humidity at various locations in the collections throughout the year. If the T and % RH data are plotted on an isoperm diagram (even as they are being collected) patterns of permanence values will develop. Large pattern differences between summer and winter conditions certainly will appear. There probably will be different patterns for significantly different areas–near windows when opened and closed, near and remote from heating ducts, areas in shade and direct sunlight, south and west facing rooms compared with those facing east and north, different floor levels and attic and basement–are some general examples.
These plotted diagrams first of all provide a quantitative estimate of the current preservation status that may be compared against accepted standards. There may be some pleasant as well as unpleasant surprises. What actions can be taken to improve conditions is very situation specific, but some possibilities are: If it is found different rooms fall into different isoperm value regions it may be possible to shift temperature and relative humidity sensitive materials in the collection to rooms of greater isoperm value. Experiments can be done changing the pattern of window opening and closing, using awnings or sunlight shields, or drawing in cool night air with small window or “whole house” fans. The % RH and T results of these experiments plotted on an isoperm diagram can measure how much, if any, improvement in conditions was achieved. Use of the “whole house” fan at night or a small window type air conditioner, while not causing drastic changes of environment, may sufficiently reduce peak summer temperatures to produce (as seen earlier in annual cycling) a substantial preservation impact.
The condition survey isoperm diagrams, together with diagrams showing the effects of changes already made and what remains to be done, can be useful tools for obtaining additional support from local benefactors and foundations. Quantitative knowledge of the preservation status of the collection can provide a powerful motivation for action.