PART 2: DATA TABLES AND CHARTS
This section contains a report of the study data. The intention is to enable readers to appraise these data independently of the interpretative essay in part 1.
The data consist of (1) the quantitative data from the study survey,
(2) a summary of the qualitative comments made by survey respondents, (3) summaries and partial transcriptions of telephone interviews with library directors and academic officers, and (4) the quantitative data from an independent survey, conducted in 2001 for the Council of Independent Colleges (CIC), on matters closely related
to the concerns of this study.
The quantitative data are presented in tabular and graph forms, along with brief explanations of how to read the tables. See part 3 of this report for an account of the research methodologies used in gathering and analyzing the study data.
Quantitative Data from the Study Survey
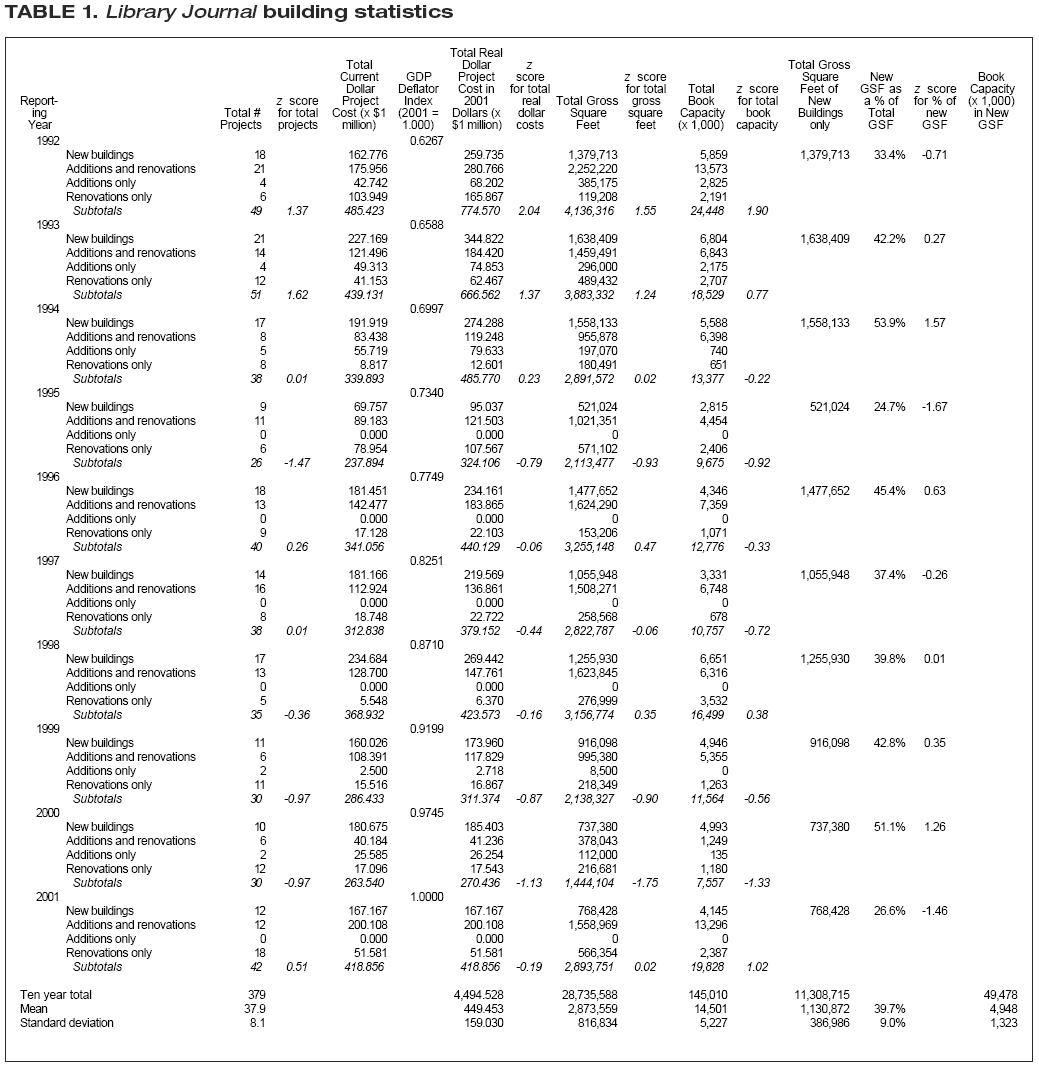
Table 1 reports, by year from 1992 through 2001, much of the data available in the list of capital projects at academic libraries published annually in the December issue of Library Journal (LJ). The data are drawn directly from LJ and are self-explanatory. The table also provides (1) a column reporting the real dollar value of projects, (2) statistical measures of the annual variability of several factors, and (3) statistical summaries of most columns for the decade covered by the study.
|
|
| Table 2 shows the number of institutions in the survey’s database of capital projects distributed by the institutional classification categories used by the Carnegie Foundation for the Advancement of Education (at http://www.carnegiefoundation.org/Classification/CIHE2000/Tables.htm). The first column lists institution types. The next three pairs of columns report the number of institutions and the percentage of all institutions found in (1) the Carnegie classification scheme, (2) the study database of institutions to which surveys were sent (the study population), and (3) the survey responses (the study sample).
Chart 1 derives from the study sample (i.e., the institutions that responded to the study survey). It reports the distribution by size (i.e., number of gross square feet) of all library projects in the sample. Chart 2 derives from the study sample (i.e., the institutions that responded to the study survey). It reports the distribution by size (i.e., number of gross square feet) of library projects in the sample that involved 100,000 gross square feet or less. Table 3a reports the responses to question 1 in the study survey. Question 1 identified several different possible motivators (items a–n in the first column) for library capital projects and asked respondents to indicate on a six-point scale how strongly each factor motivated the respondent’s project. The percentage of all responses to a given motivator (e.g., “growth of library staff”) that occupied a given point in the response scale (e.g., “not a factor”) is recorded, along with confidence interval for that percentage. A third number, called the chi-square factor, is also provided when the response varied in a statistically significant way from what one would expect in a random distribution of responses. The higher the chi-square factor, the more significant is the result. So, for example, Table 3a reports that 38.6% of all survey respondents who answered question 1a, about the growth of library staff, said that this was not a factor in their planning. |


| Table 3b (on p. W-86) reports the responses to question 1 in the study survey but differs from Table 3a in sorting the responses according to the Carnegie classification of institutions.
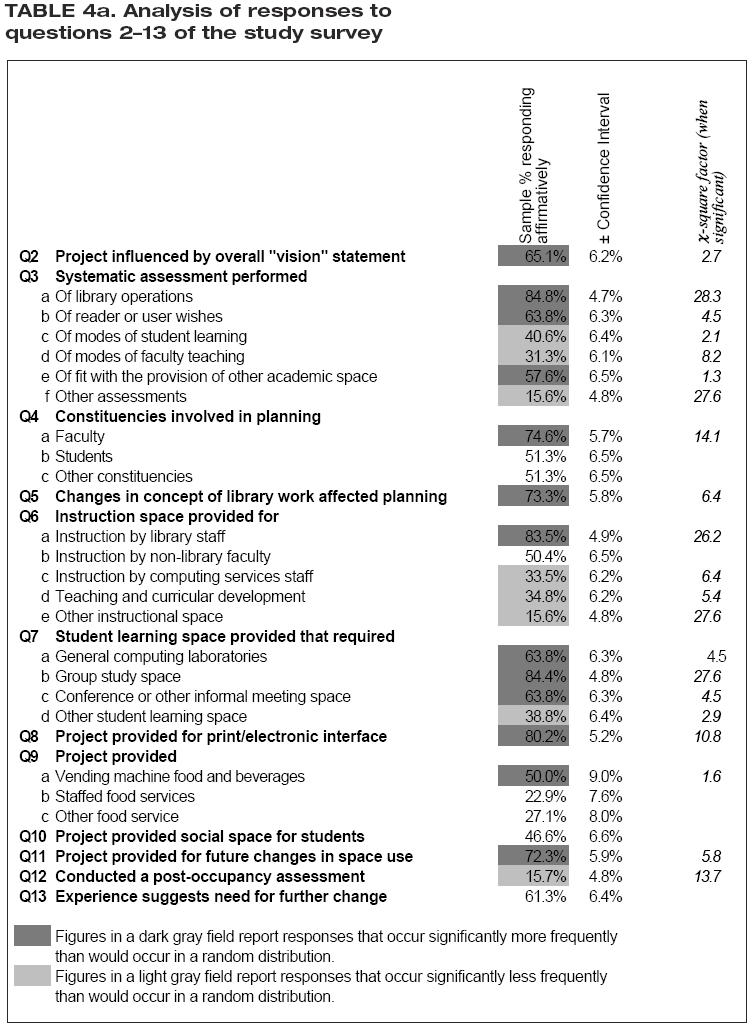
Caveat about Table 3b: Readers should understand that the relatively small number of institutions representing many of the Carnegie classification types in the study sample, as reported in Table 3b, makes inferences about the larger study population somewhat unreliable. This is indicated in the wide confidence intervals reported in this table. Table 3c (on p. W-90) reports the responses to question 1 in the study survey but differs from Table 3a in sorting the responses according to the year when projects were completed. Caveat about Table 3c: The relatively small number of projects completed in most years in the study sample, as reported in Table 3c, makes inferences about the larger study population somewhat unreliable. This is indicated in the wide confidence intervals reported in this table. Table 4a reports the responses to questions 2–13 in the study survey. It is similar to Table 3a except that all the questions are either explicitly or implicitly yes/no questions (rather than questions that invite responses on a scale). The percentage of all respondents to a given question who answered in the affirmative is recorded, along with a confidence interval for that percentage. A third number, called the chi-square factor, is also provided when the response varies in a statistically significant way from what one would expect in a random distribution of responses. The higher the chi-square factor, the more significant is the result. So, for example, Table 4a reports that 84.8% of all survey respondents who answered question 3a, about the systematic assessment of library operations, said that such an assessment was done. One can be 95% confident that responses to this question would fall within the range of 84.8 ±4.7% for the entire population of study projects. The chi-square factor of 28.3 indicates this response differs in a highly significant way from what one would expect in a random, or chance, distribution of responses to this question. In this case, dark shading is used to indicate that the response occurs more frequently than in a random distribution; light shading used elsewhere (e.g., question 3c) indicates a response that occurs less frequently than would be expected in a random distribution. |
|
| Table 4b (on p. W-93) reports the responses to questions 2–13 in the study survey but differs from Table 4a in sorting the responses according to the Carnegie classification of institutions.
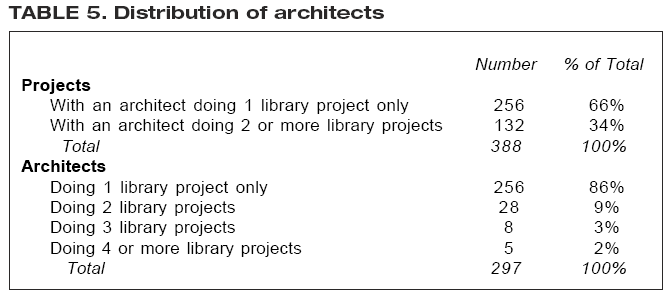
Caveat about Table 4b: The relatively small number of institutions representing many of the Carnegie classification types in the study sample, as reported in Table 4b, makes inferences about the larger study population somewhat unreliable. This is indicated in the wide confidence intervals reported in this table. Table 4c (on p. W-100) reports the responses to questions 2–13 in the study survey but differs from Table 4a in sorting the responses according to the year when projects were completed. Caveat about Table 4c: The relatively small number of projects completed in most years in the study sample, as reported in Table 4c, makes inferences about the larger study population somewhat unreliable. This is indicated in the wide confidence intervals reported in this table. Table 5 describes the distribution of projects by lead architects and of lead architects by projects in the study population. |
|
| Summary of Qualitative Comments Made by Survey Respondents
Comments are recorded under the survey question to which respondents Summary and Partial Transcriptions of the Phone Interviews with Library Directors and Chief Academic Officers As a part of this study, phone interviews were conducted with 25 library Doctoral/Research Universities-Extensive
Doctoral/Research Universities-Intensive
Master’s Colleges and Universities I
Master’s Colleges and Universities II
Baccalaureate Colleges-Liberal Arts
Baccalaureate Colleges-General
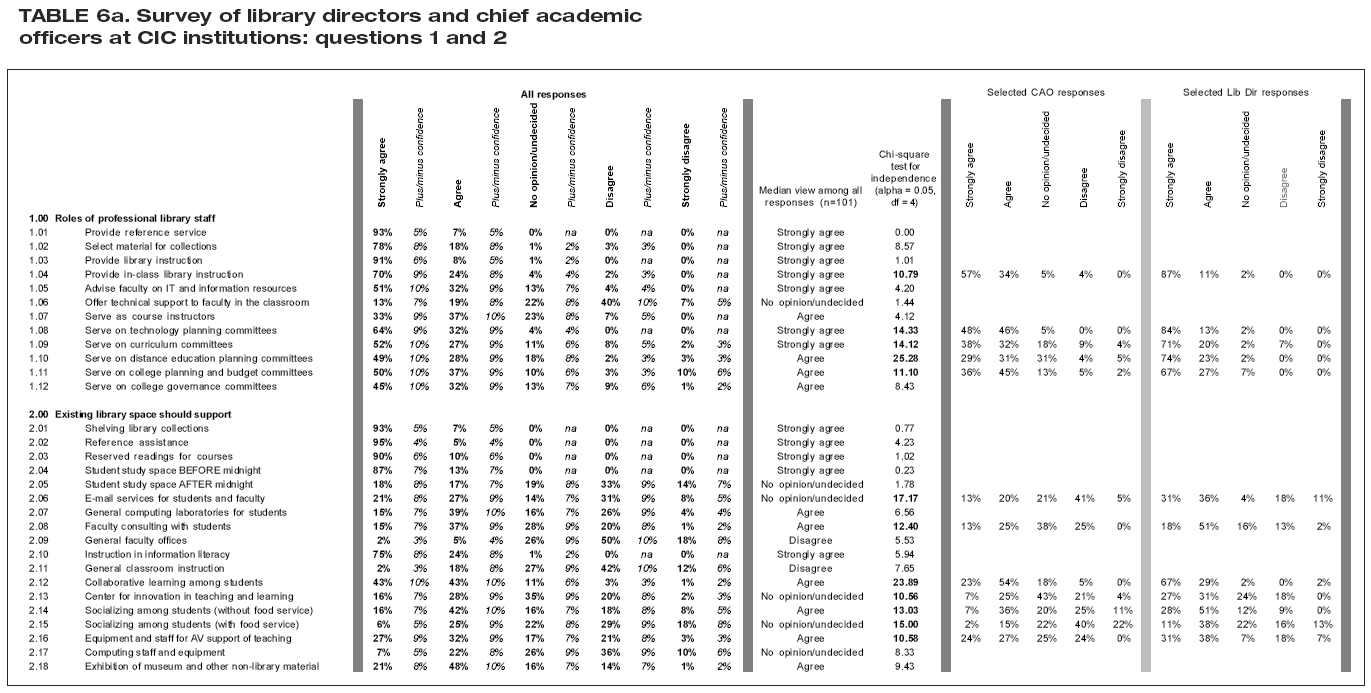
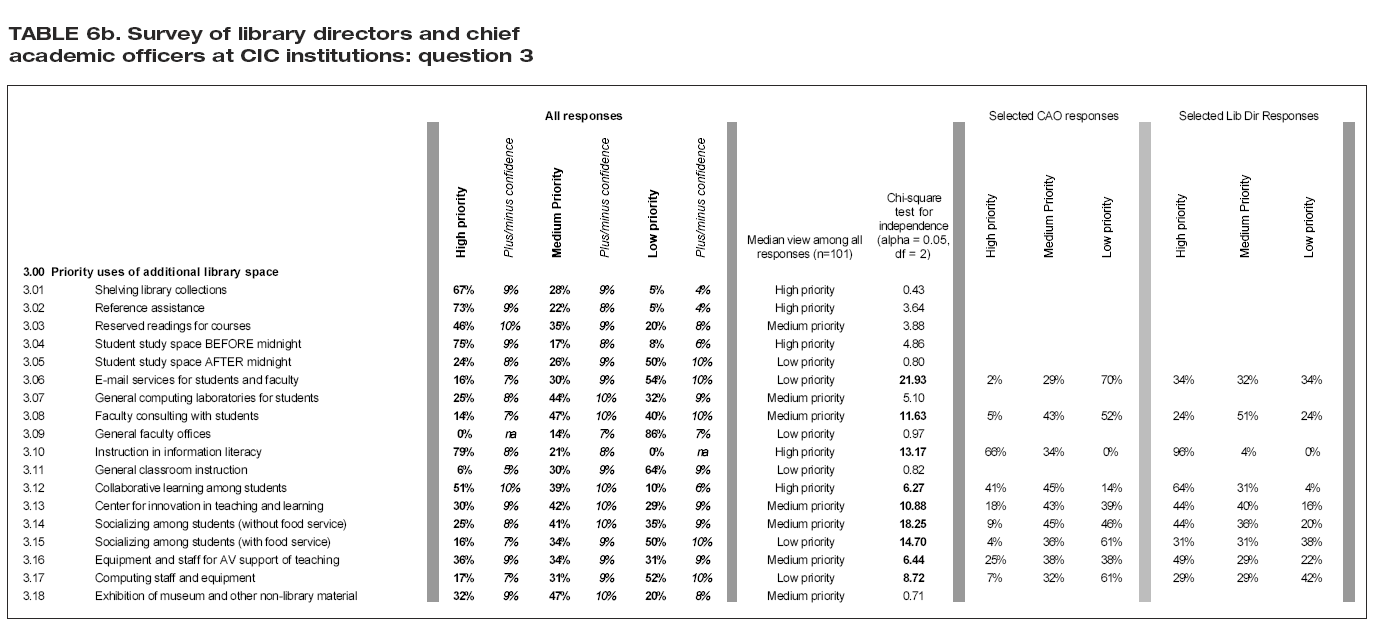
Click here (goes to p. W-116) for summaries of those interviews, with partial transcriptions of what those interviewed said. Quantitative Findings of a Survey Conducted for the Council of Independent Colleges Description of the Summary Tables
|
|
|

