Prepared by John Chadwick, John H. Falk, and Brigitte O’Ryan for the Council on Library and Information Resources
Figure 1. Number of responses from each of the participating institutions
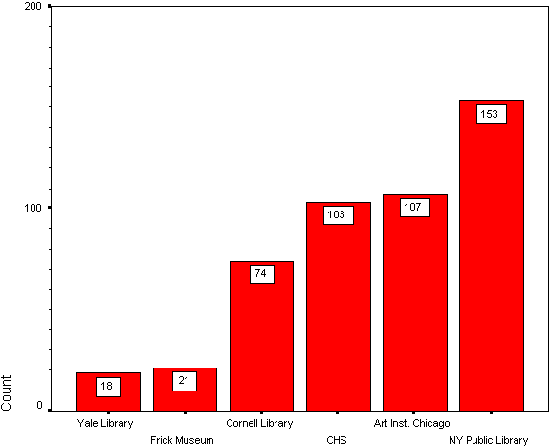
Figure 2. Percent of respondents by gender
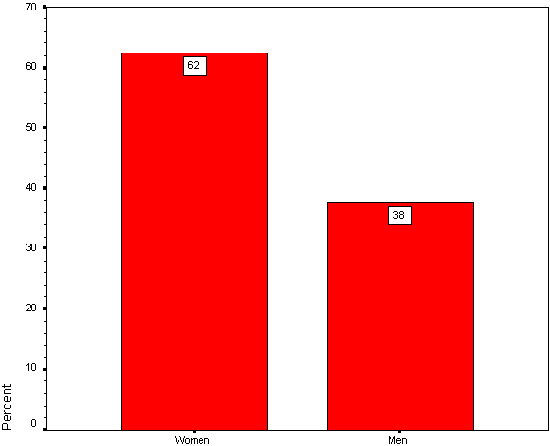
Figure 3. Why are you visiting this Web site today?
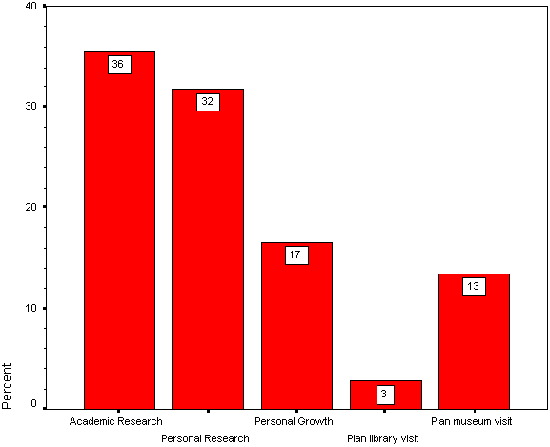
Figure 4. What is most important about the information at this Web site?
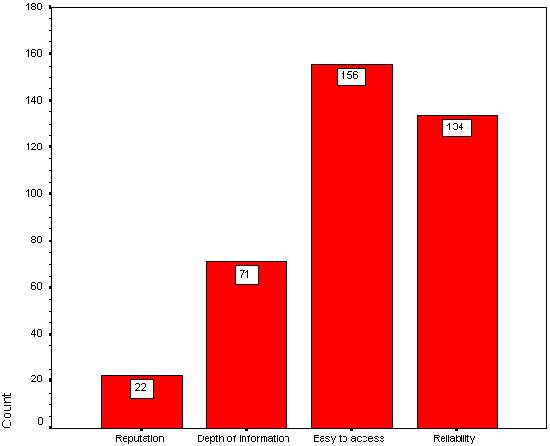
Figure 5. Total number of respondents who indicated how likely they would visit the physical site
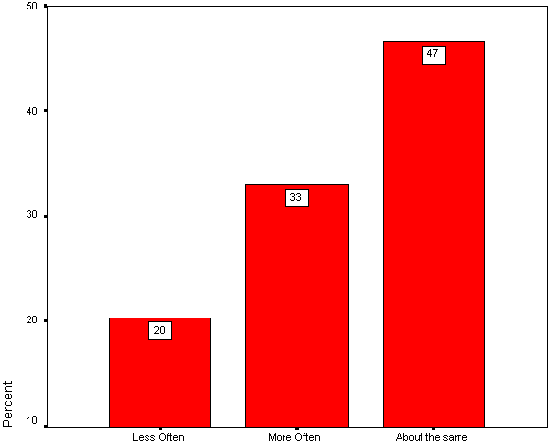
Figure 6. Where respondents said they were physically located relative to the site they were visiting
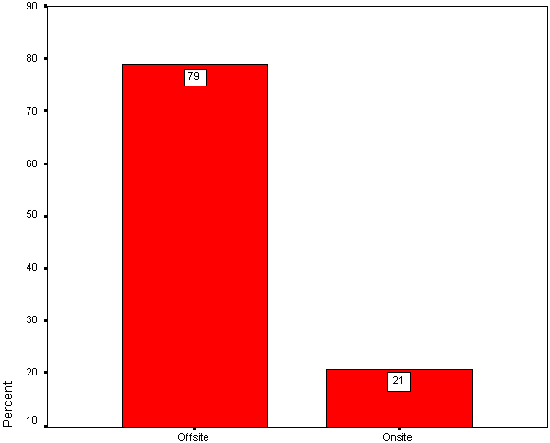
Figure 7. How online visitors found the Web site
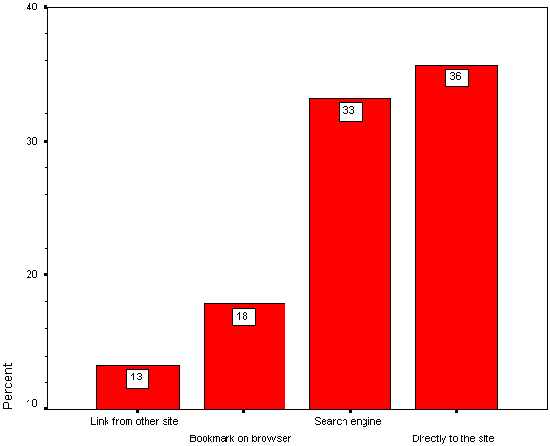
Figure 8. Aggregate of responses of users rating the reliability and trustworthiness of the sites they were visiting
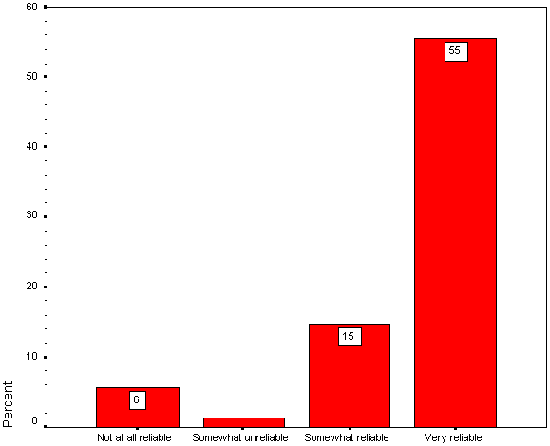
Figure 9. Ranking of importance for e-mail contact by all respondents
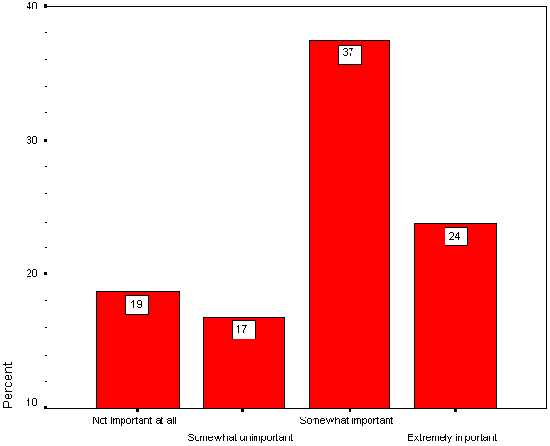
Figure 10. Overall user satisfaction with Web sites
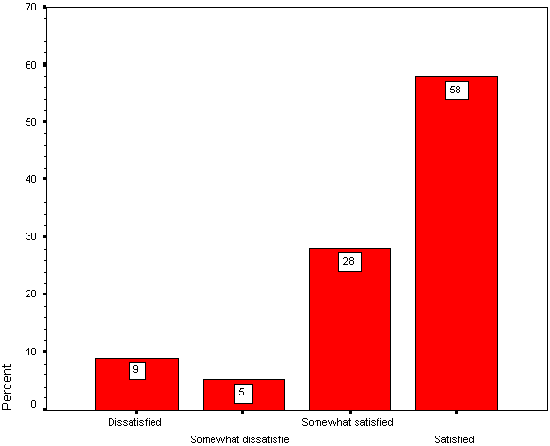
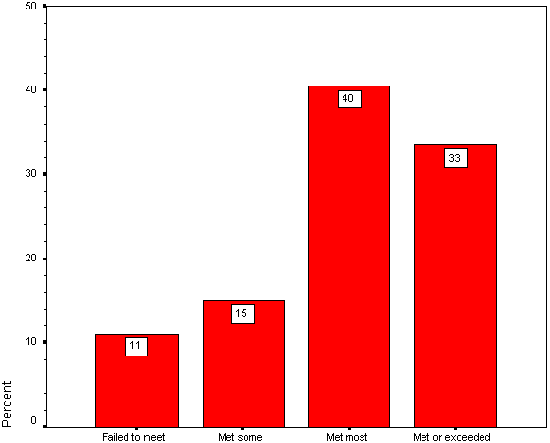
Figure 11. Overall user rating of Web sites meeting expectations
