
Discovery & Navigation
1. Checklist of cultural heritage initiatives
a. Jeff Jonas When Federated Search Bites
I am probably stepping on some folks’ toes. My apologies.
First, let me explain what I mean by federated search. Federated search: conducting a search against “n” source systems via a broadcast mechanism without the benefit or guidance of an index. This is somewhat like roaming the three buildings of the Library of Congress looking for a book title … without benefit of a card catalog.
I am speaking specifically about environments where the systems in the federation are heterogeneous, are physically dispersed, were not engineered for federation a priori, and are not managed by a common command and control system.
[snip]
Just how sure am I that federated search cannot handle discoverability at scale? How about this: First person to describe a scalable federated search system that delivers on the goals and overcomes these technical challenges … in a practical way e.g., without having to re-host source system hardware … I’ll write you a personal check for $25,000 (see small print below).
[snip]
But, don’t spend too much time on this as it’s obviously not a fair challenge. I’m just trying to make a point as it seems a number of organizations, each desperate to quickly solve large scale discoverability, are being sold on the notion of federated search. An absolute waste of money.
b. Peter Murray Video Tour of OPAC Discovery Layer Tools
… March [2008] … a presentation at theNISO forum on Next Generation Discovery Tools: New Tools, Aging Standards . . . the bulk of the presentation was in the screencast tours of the functionality of 10 OPAC enhancement tools.
c. Australia Trove …one search, a wealth of information
The presentation demonstrates the features and development which have made Trove a Government 2.0 showcase. These include opening access to information, sharing and collaborating, involving users in development, and a high level of social engagement in the service.
d. JISC Infrastructure for Resource Discovery
These projects are focused on making metadata about library, museum, and archive collections openly available using standards and licensing that allow that data to be reused
This exploration will support the discovery of approaches that will work for other Higher Education institutions. It will also permit the exploration of the major issues involved in making metadata available under an open licence, issues such as licensing, schema, provenance, authority and technical issues. Projects will be required to discuss these issues on their project blogs and JISC and relevant RDTF projects will collect these lessons and process them into appropriate formats so that the sector as a whole benefits from the projects.
2. Tools for technologists
The tools of the trade (“searching the semantic web”) are treated in some detail here. Two examples of current, large-scale efforts are noted for sake of comparison with the search, discovery, and navigation engines treated in this section:
- Sindice-Billions of pieces of metadata are on the Web today, with increasing uptake across the Internet from search engines to social sites to governments alike. The key technologies are RDF, RDFa and Microformats. Examples of such information types are contacts, events, social networks, web polls, reviews, and hundreds of other domain specific entities.
- <sameAs>-interlinking the Web of Data. The Web of Data has many equivalent URIs. This service helps you to find co-references between different data sets. It sort of does what it says-if you provide a URI, it will give you back URIs that may well be co-referent, should any be known to it. In addition, by using sindice.com, if you search for a string, it will provide bundles of URIs that correspond to looking up that string at Sindice and processing them at <sameAs>.
3. Present day interfaces built over [various forms of ] linked data
Most of the current user interfaces that make use of some form of linked-data or semantic-web infrastructure look and feel pretty much like all of today’s web-savvy search tools. Benefits come mostly in the form of improvements in the density and relevancy of links that are included in results. Not to be underestimated, the longer term benefit comes from the fact that this structured data is now of the web … it can be mined, re-purposed, and applied to other uses.
a. Status quo
A variety of examples of web environments employing various “structured metadata” techniques exist:
For a useful, recent survey of what’s up in these environs, take a look at Hidden web services: microformats and the semantic web, by Scott Davis of ThirstyHead.
b. Pushing the edge
(1) Google Instant & Yahoo Search Direct & Bing & Wolfram Alpha
Google Instant, which the company unveiled Wednesday [September 2010], is a fundamental shift: instead of search as an outcome, Google is trying to get people to think of search as a process in which you constantly refine your query without actually “searching,” or hitting the button to produce a concrete result.
Yahoo Search Direct doesn’t show new information, but it highlights the top results and the instant answers, while displaying them as you type a query. It’s a simplified version of Google Instant that only focuses on the navigational queries and the queries that request simple facts.
Notable changes [in Bing] include the listing of search suggestions as queries are entered and a list of related searches (called “Explore pane”) based on semantic technology from Powerset that Microsoft purchased in 2008. On July 29, 2009, Microsoft and Yahoo! announced a deal in which Bing would power Yahoo! Search. All Yahoo! Search global customers and partners are expected to be transitioned by early 2012
Wolfram Alpha (styled Wolfram|Alpha) is an answer engine developed by Wolfram Research. It is an online service that answers factual queries directly by computing the answer from structured data, rather than providing a list of documents or web pages that might contain the answer as a search engine would. It was announced in March 2009 by Stephen Wolfram, and was released to the public on May 15, 2009.
(2) Google search … Organizing lists of related searches (based on Freebase)
… the visual refinements (e.g., the Van Gogh example shown in the blog post) are using Freebase data (among other things) behind the scenes
via Kirrily Robert … community relations, Freebase
(3) Pennant: an interactive history of baseball
[one] can browse and view data from over 115,000 games that have taken place from 1952 to 2010. Seasons, games, and events are graphically represented in a clear, easy to interpret manner that takes them beyond the numbers. Pennant allows you to:
- View any team’s complete overall history (since 1952), showing the rise and fall of each team over time.
- Compare any team’s season to the rest of the league and see how they matched up in numerous pitching and hitting categories
- View the result of every game within a season, showing the rise and fall of the team’s league and division ranking.
- Show every event within any selected game, complete with updated score and event text
- Replay each event within a game in a timeline, allowing you to relive each play.
(4) University of Michigan Libraries, a review by their Usability Working Group and User Experience Department
4. Moving beyond search + list-of-results
Creating discovery and navigation environments that succeed in breaking with what has
- evolved from text-based interfaces over data-base driven indexes,
- worked well enough for many purposes and,
- met most people’s expectations for navigating the web
requires exploiting a very different infrastructure … one built on a densely populated fabric of named links.
Exemplars of approaches that break the mold from traditional search interfaces without the use of “linked data” include Civil War 150, NINES, and Valley of the Shadow.
a. Richard Ridge (Publishing Technology )
reflects on what pitfalls and challenges are posed by the semantic web for user experience in his Too much information? Improving user experience of semantic web:
Nokia’s Ora Lassila hypothesised a while ago as to what some of these challenges might be:
After 10+ years of work into various aspects of the Semantic Web and its constituent technologies, I am now fully convinced (read: no longer in denial) that most of the remaining challenges to realize the Semantic Web vision have nothing to do with the underlying technologies involving data, ontologies, reasoning, etc. Instead, it all comes down to user interfaces and usability. Somehow, I repeatedly run into a situation where some use of Semantic Web technologies that would make a nice end-user application is blocked by the fact that the user interface is the real challenge…. For a long time (longer than I have worked on the Semantic Web) I have wanted to build systems that work on users’ behalf. Semantic Web is one of the enabling technologies, a means to an end, and not the end itself. Every time I look critically at the current use of (information) technology, I cannot help but wonder how it is possible to actually get away with the approach taken today (where substantial burden is placed on the users).
b. Stefano Mazzocchi (Freebase/Google)
explores Convergent vs. divergent thinking in relation to human-computer interfaces:
… standardized intelligence tests have been chronically focused on measuring the ability for an individual to perform convergence tasks such as abstraction, categorization, pattern matching, logic inference, series prediction, etc. All of them are based on the idea that intelligence is the ability to somehow process information and distill models about it. The bigger (and faster) the convergence (how many items you can fit in a category, how encompassing your model is), the better, the smarter.
This is obviously an outdated idea, but it’s still a surprisingly influential meme, and I could never find a better and more resolute answer to classification of intelligent thinking.. that was until I came across the idea of ‘divergent thinking.’
While convergent thinking is about distilling few from many, divergent thinking is the opposite: start from few and come up with more.
Examples of divergent thinking are creativity, imagination, fantasy, flexibility, curiosity.
Let’s not make the mistake of thinking that rating creativity has anything to do with rating the ‘product’ of such creativity against others’, that’s a totally different thing: here, we’re merely trying to understand the ability, tendency or ease that a person has in accomplishing tasks that require divergent thinking.
Here one example of one such test: you’re told about an object, say ‘a screwdriver’, and it is asked of you to list all possible uses that you can think of that object.
What was interesting to me when I came across that test was how poorly I performed at first.
I could not think about any use of a screwdriver other than ‘screwing/unscrewing a screw’ and, say, ‘open a can of paint’. It was only after reading other people’s responses such as “a pole for a little flag”, “a pin for a hinge”, “an ice pick”, “a weapon”, “a percussion instrument” that I realized that I had been automatically applying my convergent mind onto a divergent test. Once I knew that I had to use my imagination, that the uses only needed to be even just remotely plausible, not optimal, I started to perform a lot better.
It was this personal experience with such cognitive dissonance between convergent and divergent thinking that made me realize how different such modes of operation are and how they probably powered by very different areas of our brains.
It got me wondered [sic] again about the ‘data first vs. structure first’ dichotomy, which seems to emerge constantly around me in various aspects of my job, and made me realize that the ‘data first’ approaches put the emphasis on the divergent nature of the task, while ‘structure first’ approaches put it on the convergent one.
Considering my personal experience of automatically using a convergent mode to solve a divergent task and performing poorly (and with frustration), I wonder how many times tasks are designed by people using a convergent mode and given to people that naturally tend to use a divergent one.
Could this be one of the reasons why most human-computer interfaces perform extremely poorly or create so much frustration to the average user? Because their designers used one mode of thinking during the design and their users another to actually use the software?
I don’t have an answer for that, but thinking more about it can’t hurt.
c. BBC’s Dimensions … illustrations of events superimposed on maps
Dimensions takes important places, events and things, and overlays them onto a map
Dimensions is part of the BBC’s continual experimentation in trying to find new ways to communicate history. In the case of the Dimensions prototype, it came out of a series of workshops and research in summer 2009, into what new forms of digital media could bring to the field. By building this small prototype we hope to learn more, and we’d really like your feedback on it.
We’ve built a system that can quickly take scale illustrations of historical events and superimpose them on zoomable, clickable maps. Information designers at the BBC research and produce these illustrations based on a range of library and on-line resources to make them as accurate as possible.
d. BBC’s Olympic coverage … an architectural debate … Rob Styles (Talis) posts:
I opened my mailbox the other morning to a question from David Norris at BBC. They’ve been doing a lot of Linked Data work and we’ve been helping them on projects for a good while now.
The question surrounds an ongoing debate within their development community and is a very fine question indeed:
We are looking at our architecture for the Olympics. Currently, we have:
- a data layer comprised of our Triple Store and Content store.
- a service layer exposing a set of API’s returning RDF.
- a presentation layer (PHP) to render the RDF into the HTML.
All fairly conventional-but we have two schools of thought:
Do the presentation developers take the RDF and walk the graph (say
using something like easyRDF) and pull out the properties they need.
Do we add a domain model in PHP on top of the easyRDF objects such that
developers are extracted from the RDF and can work with higher-level
domain objects instead, like athlete, race etc.
e. BBC’s Panorama episode on Public sector pay
… an interactive view of where top public-sector salaries are going
The episode … covered public-sector pay. It looked particularly into the topic of the highest-paid public sector jobs, especially the jobs of senior civil servants paid more than the UK Prime Minister.
So, we [Talis] modeled the data the BBC supplied, converted it into Linked Data and loaded the lot into the Talis Platform. The BBC’s is pulling data from their Platform stores to power the Panorama exploration tool, which you can use here.
f. LinkedIn Today … the most shared news on LinkedIn
… delivers the day’s top news, tailored to you based on what your connections and industry peers are reading and sharing.
g. Locker project: data for the people a post by Tish Shute
Fizz is an intriguing early manifestation of capabilities never seen before on the web. It provides the ability for us to control, aggregate, share and play with our own data streams, and bring together the bits and pieces of our digital selves scattered about the web (for more about Bloom and Singly, see Tim O’Reilly’s comments below). The picture below is my Fizz. The large circles represent people and the small circles represent their status updates. Bloom explained the functionality in a companyblog post:
h. Parallax
… a 2008 demonstration project by David Huynh at Metaweb/Freebase
As Marshall Kirkpatrick wrote in ReadWriteWeb:
Staff researcher David François Huynh has created an interesting tool for browsing semantic database Freebase, called Freebase Parallax. Written up by ZDNet’s Oliver Marks, the video Huynh recorded demonstrating Parallax (below) will knock your socks off.
and he closes the article with:
… some fault here may lay in the coolness ratio of the video to the Parallax app, but for now-we feel inclined to look elsewhere for the “semantic web killer app.”
Fair enough, crafting a new discovery and navigation paradigm built over a data pool that’s growing but “gappy” is no mean feat. Check out the video and judge for yourself.
i. Pelorus from Clark & Parsia … from the web site:
… a faceted navigation tool for browsing, searching, and discovering information in complex, large data sets. Featuring an easy-to-learn interface, Pelorus allows users to interact with data in a powerful and simple way. Pelorus uses W3C standards like SPARQL, RDF, and OWL to deliver a powerful tool that anyone can use to slice and dice data.
j. REEEP (Renewable Energy & Energy Efficiency Partnership)
reegle … a semantic-based clean energy search portal
REEEP, which is funded primarily by government sources, the U.K. and Norway prominent among them, has as its mission doing projects on renewable energy and energy efficiency in developing countries. As such, it sees the dissemination of information-on lessons learned, project outcomes, country laws and regulations, and so on-as one of the most important ways to create market conditions that favor those ends.
k. Reference Extract
MacArthur Foundation funded OCLC, Syracuse, University of Washington, Zepheira for a planning grant:
… designed to capture Web site URLs and references that librarians and other experts use in answering questions. This information, including data used to determine the most credible resources, is harvested, processed and then made available through a variety of Web environments. For example, Reference Extract will use a Web-based architecture that allows information to be embedded into existing and new Web sites and applications.
l. RKB Explorer
A knowledge driven infrastructure for linked data providers. The interface is here, and more here about the project’s data and tools.
RKB Explorer is a Semantic Web application that is able to present unified views of a significant number of heterogeneous data sources. We have developed an underlying information infrastructure which is mediated by ontologies and consists of many independent triplestores. Our current dataset totals many tens of millions of triples each publicly available through both SPARQL endpoints and resolvable URIs. To realise this synergy of disparate information sources, we have deployed tools to identify co-referent URIs, and devised an architecture to allow the information to be represented and used. This paper provides a brief overview of the system including the underlying infrastructure, and a number of associated tools for both knowledge acquisition and publishing
m. Thinkbase… a “visual wiki” based on Freebase using the Thinkmap environment
Thinkbase – a “Visual Wiki” – is based on Freebase, an open, shared database of the world’s knowledge. It displays the Freebase contents in an interactive graph which allows the user to visually explore more than 12 million inter-connected topics.
n. Thinkmap
A set of software components that can be configured to fulfill many different visualization tasks. [case studies for a law firm, NOAA, and Sony Music]
They have used their own technology to develop a product called Visual thesaurus
… “a visual representation of the English language.”
o. Urban Mapping… Geo Fact Finder
… a reference app to show off Urban Mapping’s new platform, Mapfluence (and its data). And, it’s pretty sweet: select up to three themes to see together on a Bing Map. I chose temperature, public transit and election returns. You can control transparency, change the classifications and more.
5. Research
The list here is highly selective, including (mostly) recent activities that were judged to offer incentives for further discussion at the Stanford Workshop.
Marcus Zillman (eSolutions Architect and Executive Director of the Virtual Private Library) has posted a valuable summary of research, tools and organizations related to navigation and discovery. Be aware that the 2011 moniker does not preclude materials that span most of the previous decade if the deemed them interesting.
a. Knowledge Discovery Resources 2011 – An Internet Miniguide Annotated Link Compilation
This Internet MiniGuide Annotated Link Compilation is dedicated to the latest and most reliable resources for knowledge discovery available on the Internet. With the constant addition of new and pertinent information coming online it is very easy to experience frequent bouts of information overload. The key is to balance this is guide to find the important knowledge discovery resources and sites both in the visible and invisible World Wide Web. The following selected knowledge discovery resources and sites offer a wide range of dependable, expert knowledge and information discovery sources to help you accomplish your research goals
Some of the Guides’ entries include :
Two additional headings appear:
- Knowledge discovery/management and data mining
organizations, collections of presentations, companies, articles - Knowledge Discovery/Retrieval and the world wide web
Entries beneath both these headings are an un-annotated checklist of links.
b. Europeana semantic searching prototype
uses linked data, which gives machines the ability to make associations and put search terms into context [prototype … intermittent access]
For example, a search for “Paris” intuitively leads to connected concepts like items in the Louvre, a Paris-based institution, or paintings portraying people named Paris, such as the Greek prince, who abducted of Helen of Troy. From there, more links point the way to topics like the “myth of Paris” or the mythical Apple of Discor-a golden apple that sparked a dispute and eventually led to the Trojan War-and then on to the forbidden apple eaten by Adam and Eve.
c. Hendler: push the scaling of integrated/linked data
… the linked data cloud (20-billion triples) … [and represents] several thousands of data bases
A few years ago Peter Mika launched the Billion Triples Track of the Semantic Web Challenge at ISWC. The goal was to push the scaling of Semantic Web technologies beyond that achievable at the time. A key part of the challenge, which still remains a major challenge, was that this was to be a billion triples of real-world (i.e., messy) data from the Web, not a specific set of triples with a nice model or ontology underlying them.
In the past couple of years, that “billion” has become a fairly easy mark to hit, and many datasets on the Semantic Web have gone beyond that by an order of magnitude or two. However, this increase in the scaling of the SPARQL databases has somewhat obscured the issue of the growing heterogeneity issues as more and more of this large scale data becomes available and more-and-more linked. For example, much is made of the fact that the linked data ‘cloud’ now has well over 20-billion triples in it and continues to grow at a rapid rate. Much more interesting, however, is that it also has over 200 different datasets in it, some of which themselves were composed from linking numbers of datasets (particularly the government and biological data), so that several thousands of data bases are represented.
Think about this-in the database community one of the primary research foci is on scaling to and using datasets that are in the multiple terabyte size. However, in the Semantic Web community, we are now approaching those sorts of scales, but with data for which we don’t have one model, but potentially thousands (or even millions, as I discuss in the next section). Within the database community there is a small but growing interest in the large-scale linked data are and within the linked-data community there is an increasing understanding of our need to explore, without reinventing, how database technologies can help support large-scale heterogeneity. But it is clear we need more-what is the theoretical base on which we can explore this better? How do we go from the early breakthroughs of LarKC and similar projects to providing some firmer basis for large-scale representation and reasoning at the level needed by these projects?.
d. personal research content management + ontology add-in-Microsoft
ScholarLynk
… a collaborative content management and scholarly communication prototype
Ontology Add-in for Word
… An open-source tool that simplifies the development and validation of semantic ontologies, making ontologies more accessible to a wide audience of authors and enabling semantic content to be integrated in the authoring experience, capturing the author’s intent and knowledge at the source, and facilitating downstream discoverability.
e. Mozilla’s Aurora… a concept video by Adaptive Path in partnership withMozilla Labs
With Aurora, we set out to define a plausible vision of how technology, the browser, and the Web might evolve in the future by depicting that experience in a variety of real-world contexts.
The release of Aurora is part of the launch of Mozilla Labs’ browser concept series, an ongoing initiative to encourage designers and developers to contribute their own visions of the future of the browser and the Web. Over the next couple of weeks, we’ll be releasing more video segments, as well as background material showing just what went into imagining the future of the Web and translating that into a video.
f. Processing the LOD cloud with BigQuery … thoughts on cloud resources for projects
Google’sBigQuery is a large-scale, interactive query environment that can handle billions of records in seconds. Now, wouldn’t it be cool to process the26+ billion triples from theLOD cloud with BigQuery?
I guess so.
So, I did a first step into this direction by setting up theBigQuery for Linked Data project containing:
- A Python script callednt2csv.py that converts RDF/NTriples into BigQuery-compliant CSV;
- BigQueryschemes that can be used together with the CSV data from above;
- Step-by-stepinstructions how to use nt2csv.py along with Google’sgsutil andbq command line tools to import the above data into Google Storage and issue a query against the uploaded data in BigQuery.
g. ProBase-Microsoft
project goal: understand human behavior and human communication [slides]
Knowledge in Probase is harnessed from digitized footprints of human behavior and communications … Probase is extremely rich in concepts. The core taxonomy alone contains about 2.7 million concepts … Probase has a large data space. As an example,Cyc contains about two dozen painters, while Probase has close to 1,000 of them ordered by their popularity.
h. Rummble Labs
personalized recommendations technology based on proprietary trust algorithm
Rummble Labs has pioneered an innovative approach that automatically optimizes the selection of the most appropriate recommendation algorithm, or combination of algorithms (such as collaborative filtering, the trust algorithm and semantic analysis), based upon the type of data and context.
Further, the platform constantly evolves to provide more intelligent insights as additional patterns are formed. This proprietary API is built from scientifically validated algorithms that filter data in real-time to increase the accuracy and reach of personalisation.
Louisa East, Commercial Director at Rummble Labs who joined this week from San Francisco, commented: “Rummble Labs aims to change the way in which people can find recommendations for products and services whether that be clothes, wines, music or books.
With web users crying out for more personalised content, we look to help drive this new Age of Relevance.”
i. Shneiderman on social discovery at NFAIS 2011
Social Discovery in an Information Abundant World and commentary (NFAIS 2011)
The first generation of search tools have provided remarkable capabilities to many researchers for finding specific information, navigating to desired web sites, or tracking down needed documents. A second generation of tools is increasingly helping researchers in supporting exploratory search in situations where the goals are less clear, where complete coverage is necessary, and where proof of absence is required (patents, legal precedents, etc.). However, the third generation of tools turns search into social discovery, in which colleagues, informal groups, for-profit companies, professional organizations, and international federations are motivated to find, filter, organize, annotate, and summarize voluminous information resources. The Reader-to-Leader framework proposes the usability and sociability design needed to integrate the efforts of readers, contributors, collaborators, and leaders, but much work remains to be done to validate this framework and refine it in multiple contexts.
j. SQUIN (Semanticweb Query INterface) Olaf Hartig, Juan Sequeda
Our aim is to enable Web applications to consume Linked Data from the Web. With SQUIN we provide a query service as an addition to the LAMP technology stack. This service executes queries over the whole Web of Linked Data and, hence, enables applications to access the whole Web as if it is a single giant database.
k. Tree map of NARA test-bed collection
A Window on the Archives of the Future: TACC (Texas Advanced Computing Center), a project based on a 3-million file NARA test collection.
The overall goal of the research is to investigate different data analysis methods within a visualization framework, which acts as a bridge between the archivist and the analysis results, which are rendered visually onscreen as the archivists make selections and interact with the data. The results are presented as forms, colors and ranges of color to assist in synthesis and to facilitate an understanding of large-scale electronic records collections.
l. Visual interfaces
Visual Interfaces to the Social and Semantic Web (VISSW)
In this context, the ability to easily integrate vast amounts of data from across the Social and Semantic Web raises significant and exciting research challenges, not least of which [is] how to provide effective access to and navigation across vast, heterogeneous and interconnected data sources.
However, the need for intelligent and visual human interfaces to this evolving Web is not limited simply to the modalities of searching and browsing, important as these are. As the Web becomes increasingly populated with data, continues to evolve from a read-mainly to a read-write medium, and the level of social interaction supported on the Web increases, there is also a pressing need to support end-users who engage in a wide range of online tasks, such as publishing and sharing their own data on the Web. Exploring different aspects of those developments and their implications for visual interface research and development is one of the goals of the workshop.
International Conference on Intelligent User Interfaces (IUI)
IUI is the annual meeting of the intelligent interfaces community and serves as the principal international forum for reporting outstanding research and development on intelligent user interfaces.
m. Visualization of scientific collaboration between researchers
My employer, Science-Metrix, is [a] bibliometric consulting firm. In other words, we engineer ways to measure the impact and growth of scientific discovery (and publications) in the world. To accomplish this, we license data from scientific journal aggregators like Elsevier’s Scopus and Thomson Reuter’s Web of Science. The data we have is bibliographic in nature. We don’t have the full text of the articles but rather citation networks, authors and their affiliations, abstracts, etc.
6. One-off visualizations
Techniques for providing access to structured data via visual representations have been around as long as graphic interfaces. What’s beginning to change is the ad hoc use of web-based information pools to drive meshups and mashups. As the amount of structure in the underlying data improves, the overhead for creating these visualizations decreases.
a. Glenn Macdonald provides a useful perspective on this type of activity in his Visualization and generality:
|
This Newsweek best-country infowidget is plainly cool. Run your mouse down the list of countries, top to bottom, and watch the waves ebb leftwards. Run it along any of the lines and see the spiky flow whip along the others. Pick subsets along the top and see dots light up across the lines. This is data sorcery, turning mute masses of numbers into effortless insight. Insight? Sight, anyway. |
click to enlarge |
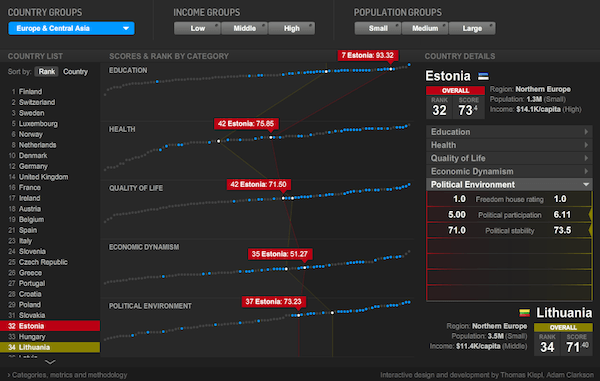
As a designer of generalized data-analysis tools, though, I’m almost invariably frustrated by these things. They look like magic, and I have lots of places where I want things to look like magic. But to look like magic, reliably, they actually have to work like machines. I want to be able to pour other data into this structure. I admire the heroism that went into solving this one specific information-display problem, but I don’t want every new data-analysis task to always require new heroism. If you have to keep doing it over and over again, it’s not heroic any more.
But when I start taking these things apart, so that I can figure out how to put them back together with other data inside, I discover altogether too much convenient “magic” where I need simple reliable gears and levers.
[snip]
And how, even if we could answer all those questions, do you get any other set of data into this? How do you manage the data behind this? Where is “behind this”?
So yes, this is cool. I’m glad it exists. But I can’t help feeling like this is not really the way we win the war against ignorance. We can’t afford to solve every problem with this much specificity. And even this, I suspect, is a symptom: we get solutions with such specificity because there is such a poverty of solutions with generality. When there’s no easy way, all the hard ways start sounding about the same.
And thus my own far less glamorous life with data: lists, tables, numbers, the occasional stripe of color. It won’t let you makes waves and spikes out of your data, but then, neither will this. This thing won’t let you do anything with your data.
Something should.
b. David McCandless … his The beauty of data visualization at TED
… turns complex data sets like worldwide military spending, media buzz, Facebook status updates and more into beautiful yet simple diagrams. He proposes design as the tool we use to navigate today’s information glut, finding unique patterns and connections that may just change the way we see the world..
c. New York Times census visualization
Web-based authoring tool for weaving images, maps, charts, video and data into visualizations.
The New York Times’ “Mapping America” visualization is a good illustration of this strong heritage between cartography and data visualization. It consists of an interactive map of data extracted from the American Community Survey Census, based on samples from 2005 to 2009 and including indicators such as ethnic groups, income, housing, families and education.
d. VisualEyes, University of Virginia
Web-based authoring tool for weaving images, maps, charts, video and data into visualizations.
VisualEyes enables scholars to present selected primary source materials and research findings while encouraging active inquiry and hands-on learning among general and targeted audiences. It communicates through the use of dynamic displays—or “visualizations”—that organize and present meaningful information in both traditional and multimedia formats, such as audio-video, animation, charts, maps, data, and interactive timelines.
e. What’s in a surname?
A new view of the United States based on the distribution of common last names shows centuries of history and echoes some of America’s great immigration sagas. To compile this data, geographers at University College London used phone directories to find the predominant surnames in each state. Software then identified the probable provenances of the 181 names that emerged.
7. Visualization in general … examples
a. Meryl Evans … 175+ Data and Information Visualization Examples and Resources (2008)
b. Hjalmar Gislason of DataMarket … Data and Visualization: Predictions for 2011
DataMarket is building an active marketplace for statistics and structured data. We believe in a “visual data exploration” approach, meaning that users’ first experience with any data is a visualization that should provide a quick overview of what the data is all about, then allowing users to dig deeper to see the raw numbers, download the data in various formats, embed it in other web content or connect to the data live using our API.
c. Manuel Lima … VisualComplexity.com
… intends to be a unified resource space for anyone interested in the visualization of complex networks. The project’s main goal is to leverage a critical understanding of different visualization methods, across a series of disciplines, as diverse as Biology, Social Networks or the World Wide Web. I truly hope this space can inspire, motivate and enlighten any person doing research on this field.
Complexity is a challenge by itself. Complex Networks are everywhere. It is a structural and organizational principle that reaches almost every field we can think of, from genes to power systems, from food webs to market shares. Paraphrasing Albert Barabasi, one of the leading researchers in this area, “the mystery of life begins with the intricate web of interactions, integrating the millions of molecules within each organism.” Humans, since their birth, experience the effect of networks every day, from large complex systems like transportation routes and communication networks, to less conscious interactions, common in social networks.
d. Andrew Vande Moere … Information aesthetics.Where form follows data.
Inspired by Lev Manovich’s definition of “information aesthetics”, this weblog explores the symbiotic relationship between creative design and the field of information visualization. More specifically, it collects projects that represent data or information in original or intriguing ways. Since its conception in December 2004, several other terms have been introduced within the academic world for similar phenomena, ranging from ‘Information Aesthetic Visualization’ over ‘Casual Information Visualization’ to ‘Artistic Data Visualization.’
e. Nathan Yau FlowingData … 10 Best Visualization Projects of the Year—2010
One of the major themes for 2010 was using data not just for analysis or business intelligence, but for telling stories. People are starting to make use of the data (especially government-related) that was released in 2009, and there was a lot more data made available this year (with plenty more to come). There were also more visualization challenges and contests than I could count.